
Cryptocurrency
Trading Bitcoin: Ascending Triangle to $13.5k
Ascending Triangle to $13.5k Bitcoin has been on an unprecedented run throughout the past week. The chart above highlights a potential ascending triangle forming on the 1 hour chart. This particular formation is not a perfect triangle, but it is still worth considering. Ascending triangles break to the upside 70% of the time. Therefore, this […]

Ascending Triangle to $13.5k
Bitcoin has been on an unprecedented run throughout the past week. The chart above highlights a potential ascending triangle forming on the 1 hour chart. This particular formation is not a perfect triangle, but it is still worth considering. Ascending triangles break to the upside 70% of the time. Therefore, this measured move has the potential to take us to $13.5k in the short-term. This pattern does not have to play out, nevertheless, it should be recognized as a bullish continuation pattern.
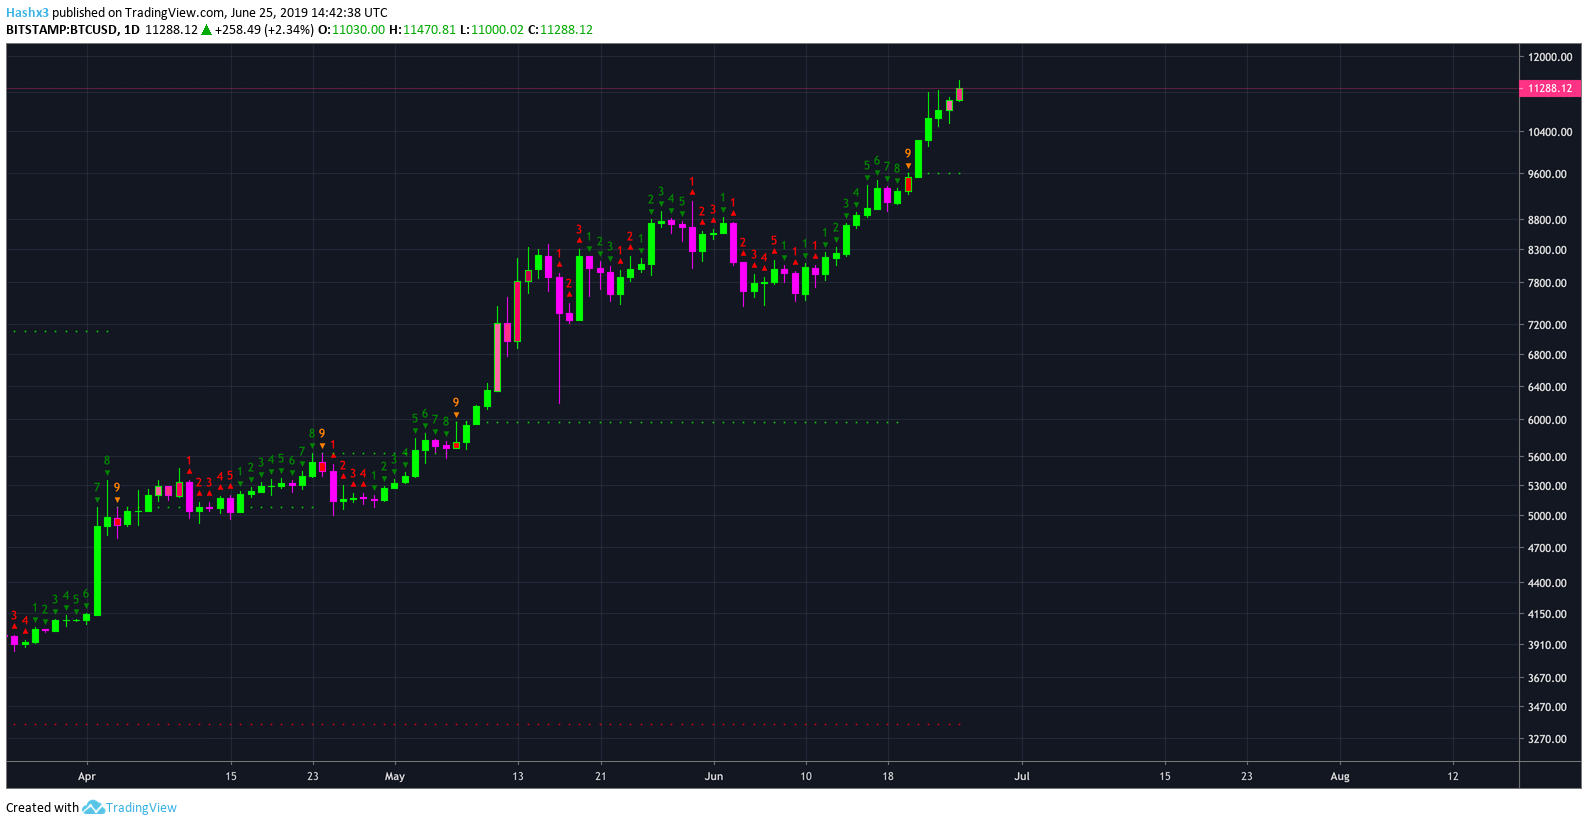
Daily
Bitcoin is currently on a green 5 candle succeeding a green 9. Therefore, the sequential indicator is telling us Bitcoin is very bullish for the next three to four days.
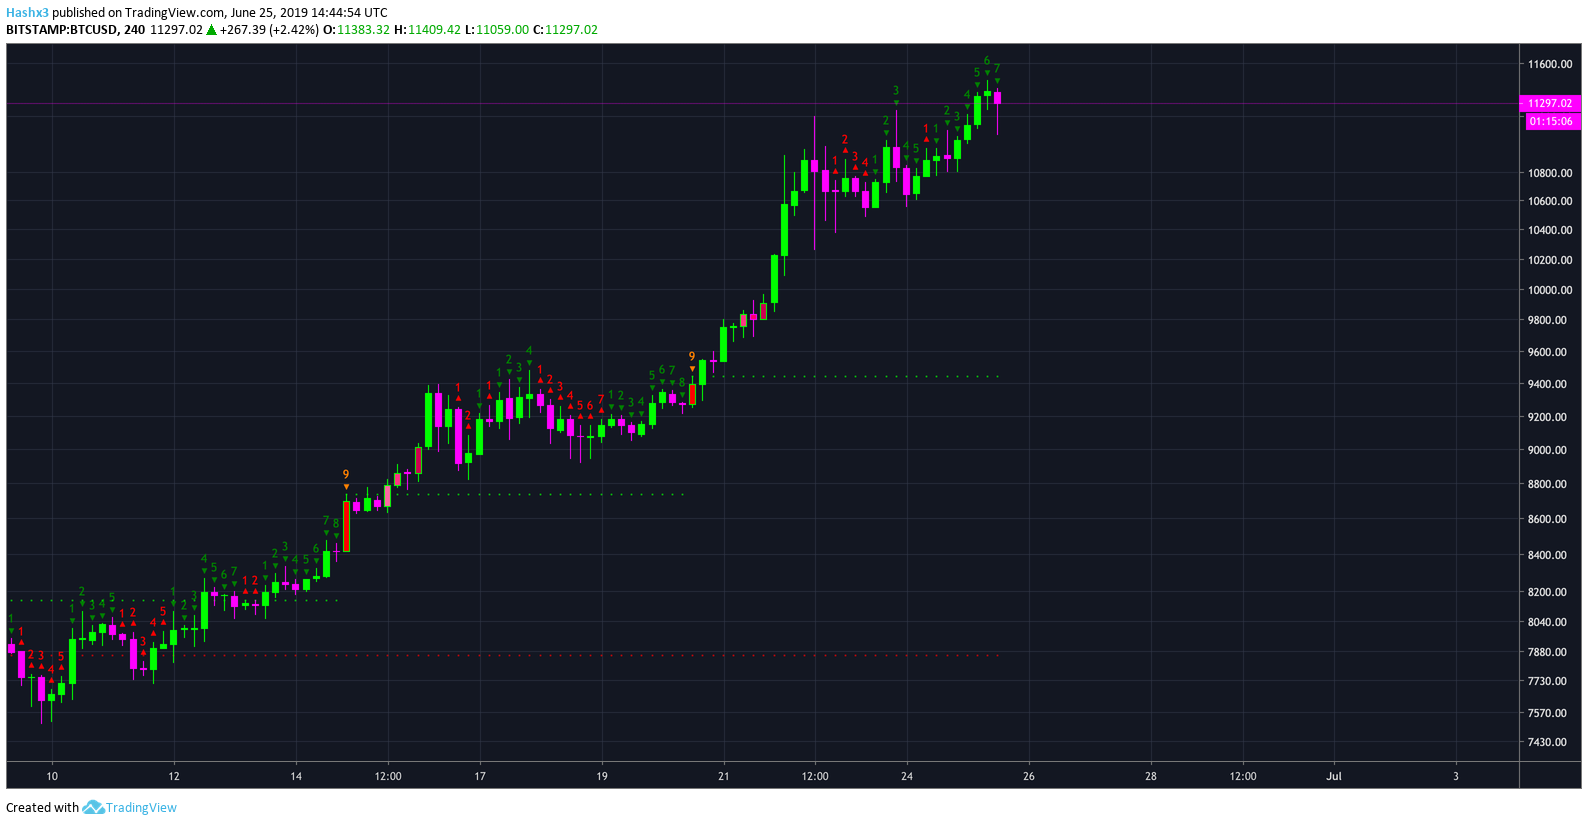
4 Hour
Bitcoin is still holding a parabolic trend line on the 4 hour. Additionally, Bitcoin’s 4 hour chart is currently on a green 7 of 9 candle. Furthermore, this countdown phase on the 4 hour chart paired with the bullish continuation on the 1 hour and daily chart give Bitcoin a high likelihood of increasing to $13.5k in the near future.
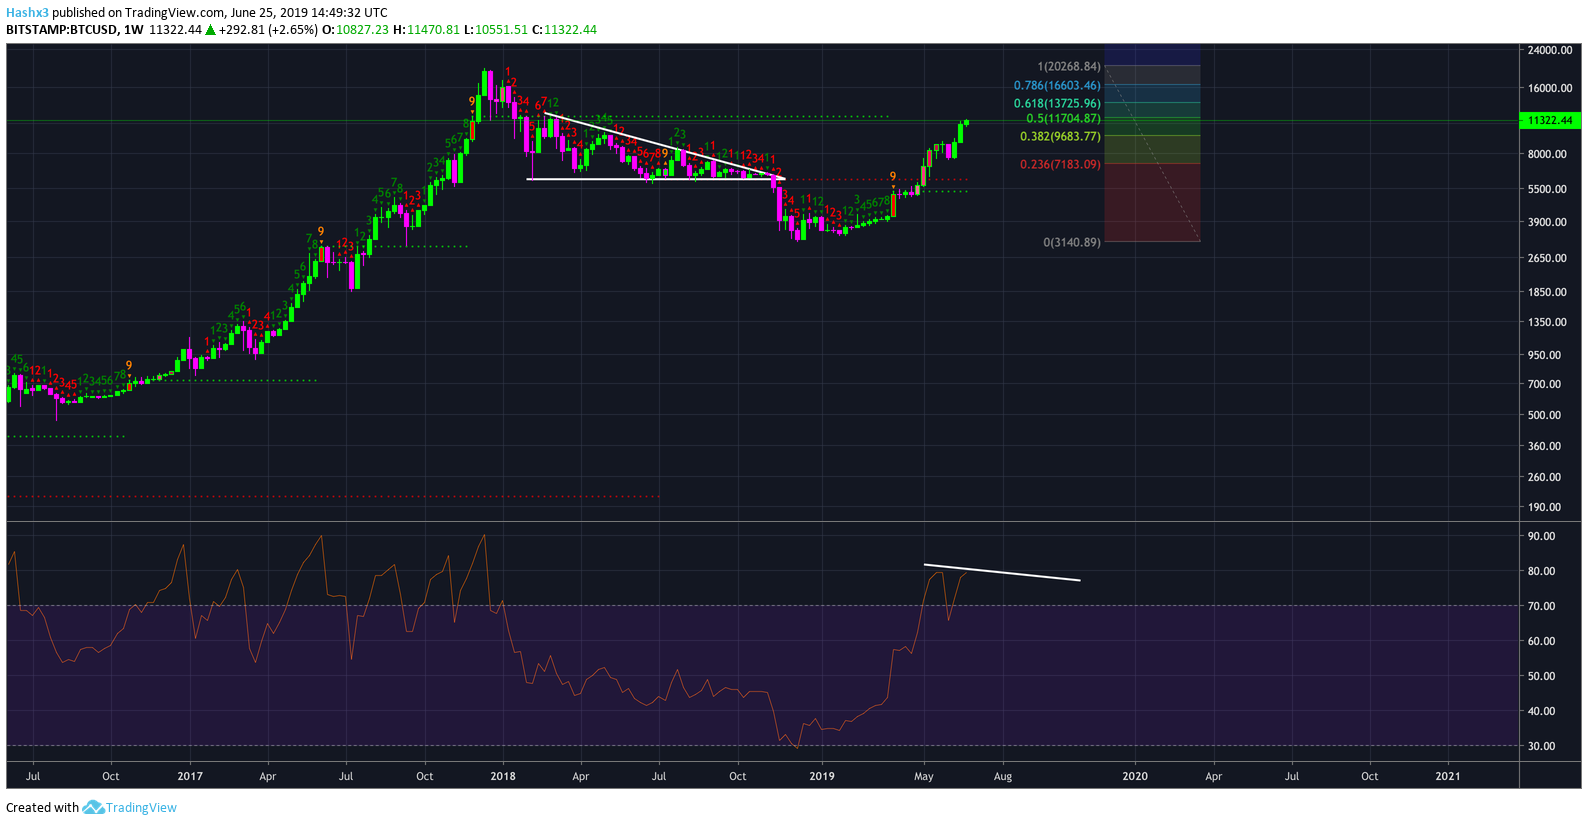
Weekly RSI Bearish Divergence
As the market becomes more greedy and price continues to increase, watch the weekly RSI for a view of the macro structure. If Bitcoin’s price continues to rise to $13.5k and RSI fails to make a higher-high, expect a large pullback of up to 30-40%. Currently, price looks strong as Bitcoin’s incredible run continues. Bitcoin’s weekly sequential indictor is currently on a green 3 showing more upside potential. Notably, Bitcoin faces its next resistance at the 0.618 fibonacci level at $13.5k.
Conclusion
The market is elated and the bulls continue to dominate. As of now, ‘the trend is your friend’ and the sequential indicator is bullish across a majority of timeframes. Bitcoin may be forming a bull flag and/or ascending triangle which, with a measured move, would extrapolate us to a target of $13.5k. This level also has confluence with the 0.618 golden fibonacci level which typically acts as resistance. For these reasons, we expect a rejection at $13.5k followed by a drastic flash crash of 30-40%. On a macro perspective, Bitcoin’s monthly chart is also incredibly bullish. For more information, we discussed Bitcoin’s monthly chart in yesterday’s Bitcoin update.