
Cryptocurrency
Bitcoin Tops at $5.6k and the Shorts Are Stacking Up. Now What?
Currently, Bitcoin is consolidating after dropping from a high of roughly $5.6k earlier this week. Bitcoin is at a turning point which will determine whether the bulls climb higher and enter a bull market, or fail to break resistance and fall to a new higher low. Bitcoin has formed support at $5.2k and price has […]
Currently, Bitcoin is consolidating after dropping from a high of roughly $5.6k earlier this week. Bitcoin is at a turning point which will determine whether the bulls climb higher and enter a bull market, or fail to break resistance and fall to a new higher low. Bitcoin has formed support at $5.2k and price has remained fairly consistent for the previous 48 hours. Bitcoin’s next move will be pivotal in deciding the momentum of the macro trend of the entire cryptocurrency market. After all, Bitcoin is the rising tide which lifts all ships.
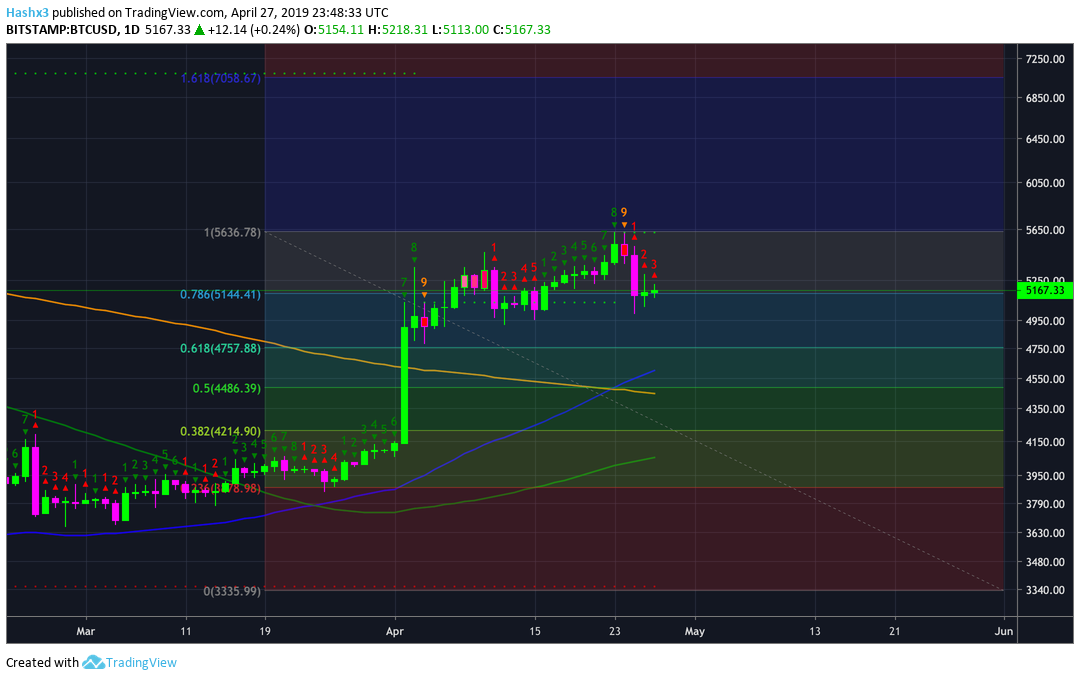
Some are bullish because of the golden cross which has now occurred on the daily chart above.
A golden cross is characteristic of macro bullish momentum and it occurs when the 50MA (blue) crosses through both the 128MA (green) and 200MA (orange). When looking at the sequential indicator above, Bitcoin is currently at a red 3 on the daily chart which may continue downward momentum until it leads to a red 9 later in the week.
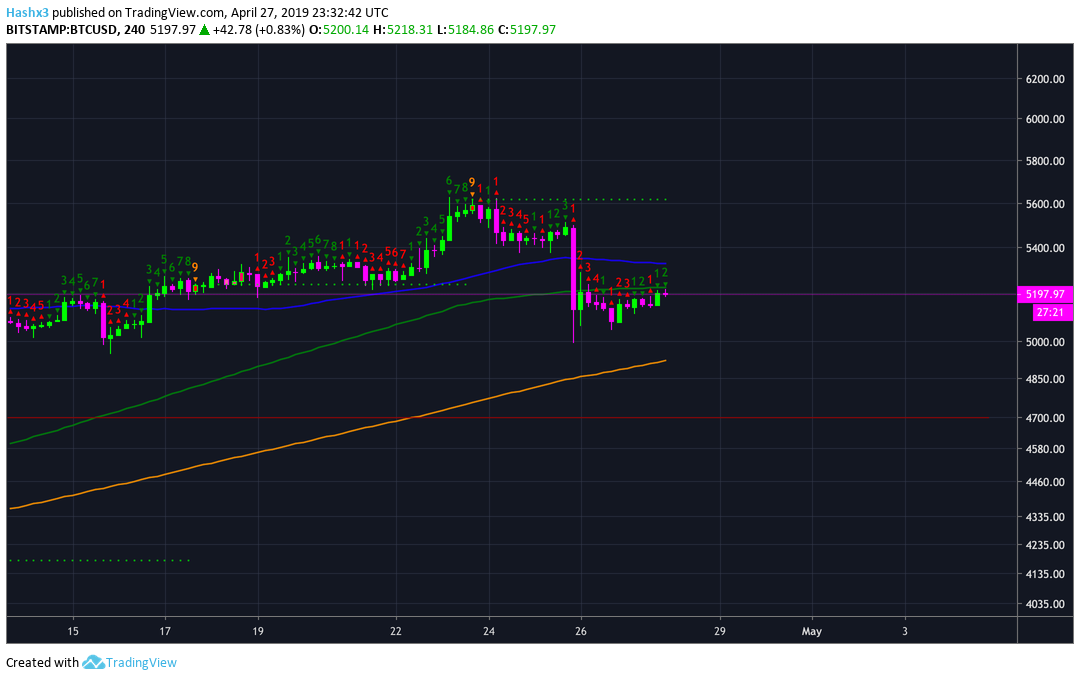
Bitcoin on the 4hr chart above is now trading below both the 50MA (blue) and 128MA (green) which may act as harsh resistance preventing price from moving higher in the short-term.
Additionally, the 200MA (orange) is the last moving average which is acting as support around $4.9k. If this support level is broken after being tested multiple times, further downward momentum will likely ensue as price is pushed back down to the $4.6k – $4.8k price channel. The last time Bitcoin traded below these three moving averages on the 4hr chart was in February 2019 at a price of of $3.2k. Breaking below these levels would be a strong indicator that more short-term bearish price action is likely to occur. Also, it is worth acknowledging there is very little prior support anywhere from $4.9k – $4.1k, which Bitcoin could easily drop to if more selling volume enters the market.
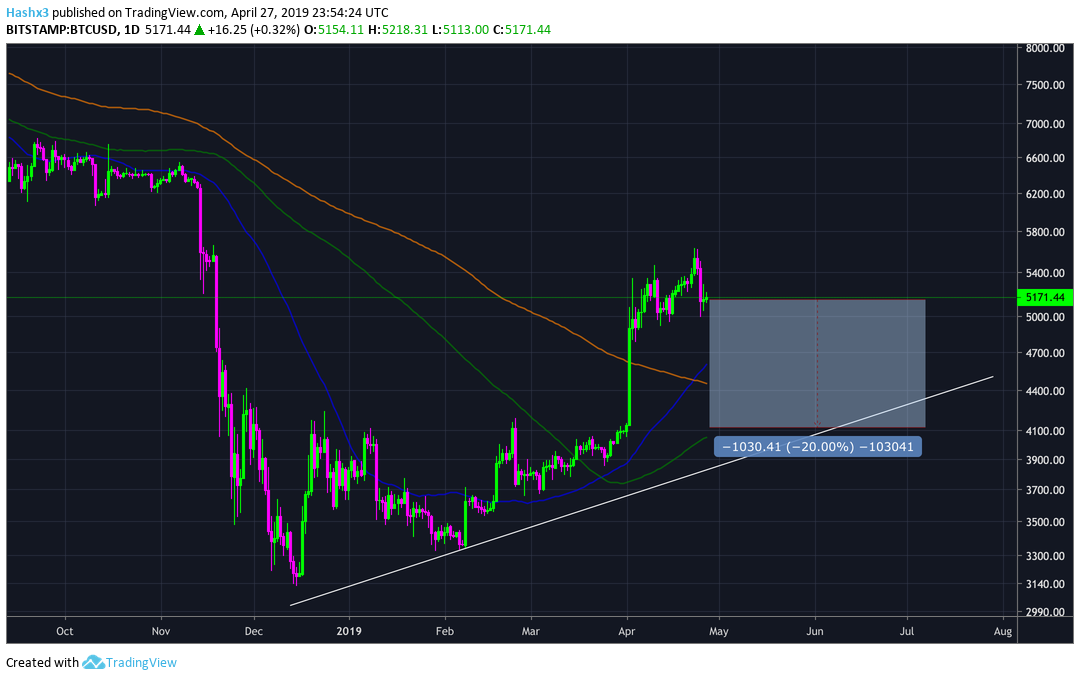
The good news for the bulls is that Bitcoin could drop by 20% and still look bullish on the macro trend.
As long as Bitcoin remains above the upward sloping trend line, the macro trend will still have bullish potential. A correction of this sort would actually be healthy for the market because it would allow Bitcoin to make a true higher low leading to the beginning of an ascending triangle formation. From a bullish perspective, we would ideally want to see an ascending triangle begin to form at the resistance level of $5.6k. Judging by the previous support levels, Bitcoin now faces incredible resistance at $6k which will likely require multiple attempts before breaking above resistance. If Bitcoin continues to create higher lows and form an ascending triangle at $5.6k, then there will be strong evidence for the beginning of the bull market. If Bitcoin breaks below the upward sloping trend line (white) located on the chart above, then the previous situation is no longer relevant.
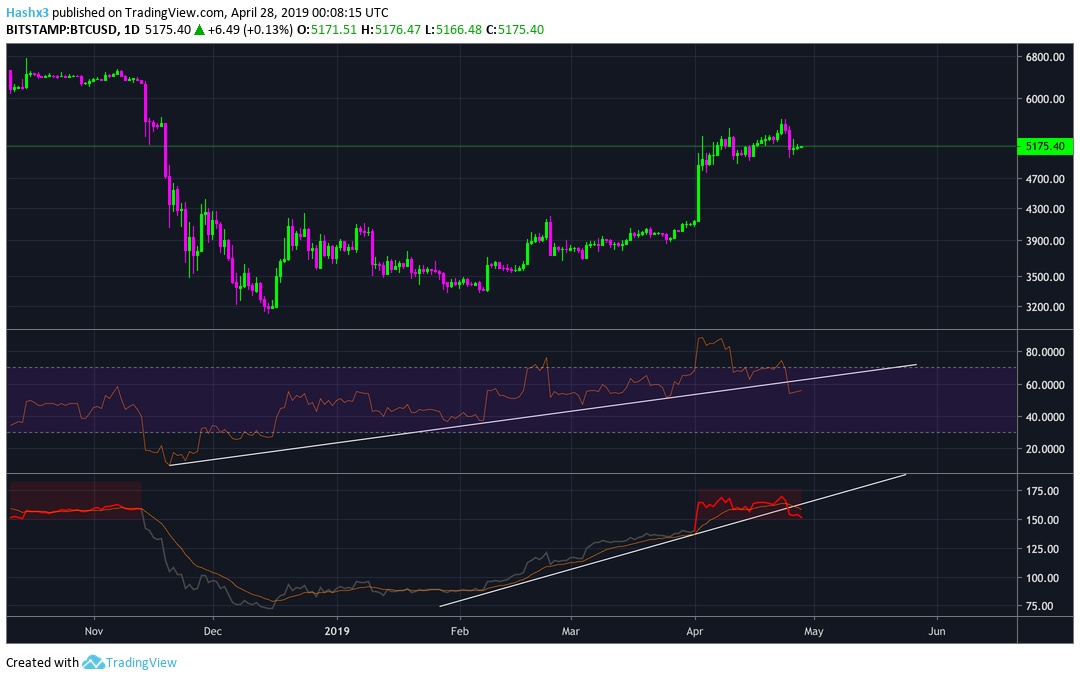
Looking at the RSI above, it is evident that we are still in neutral/overbought territory but we have now broken below our upward sloping trend line which may indicate upward momentum is dying. The same is true for the NVT (Network Value to Transactions) located in the chart above. These levels are not ultra-significant, however, they can be used to accurately signify the beginning of a tentative trend exhaustion.
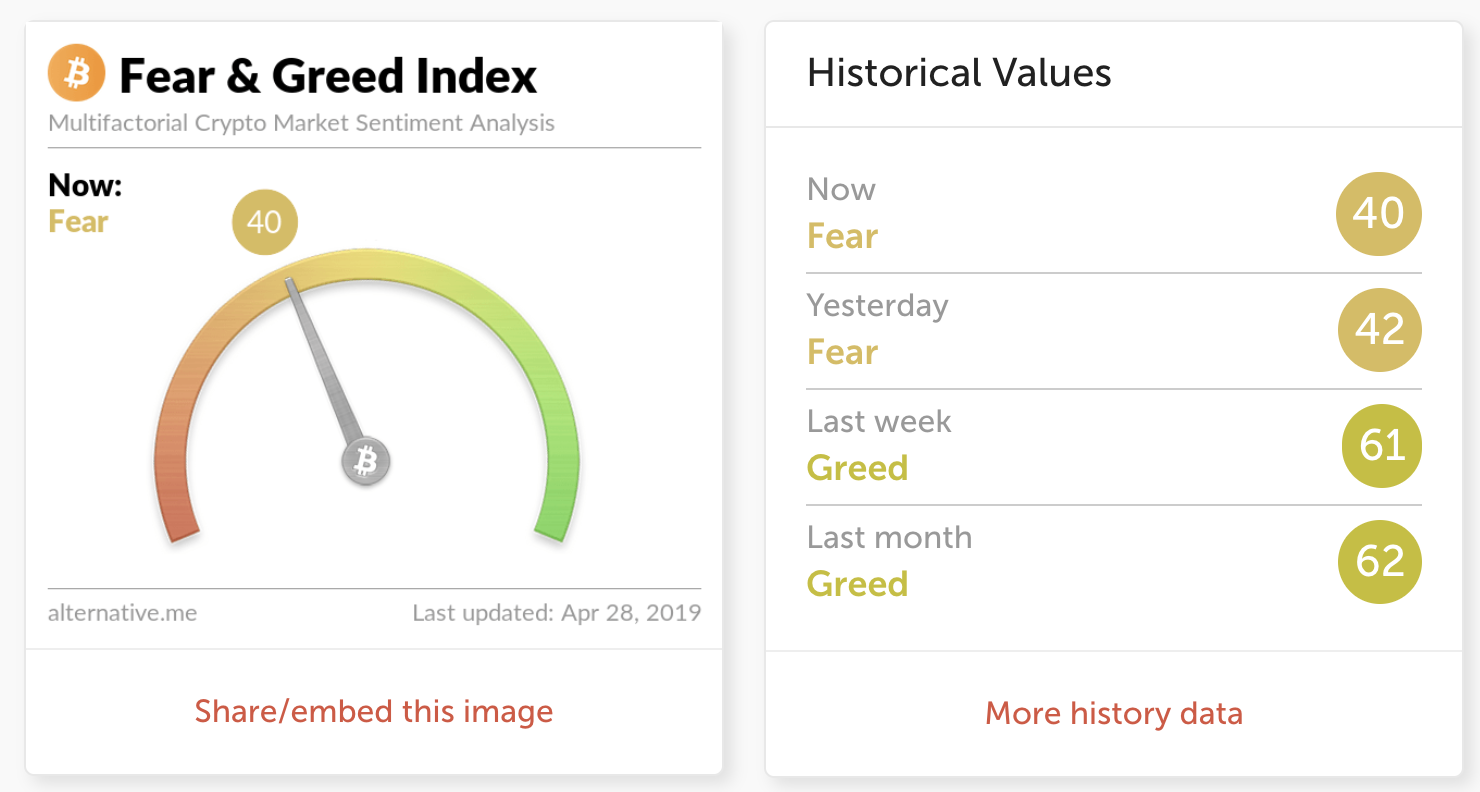
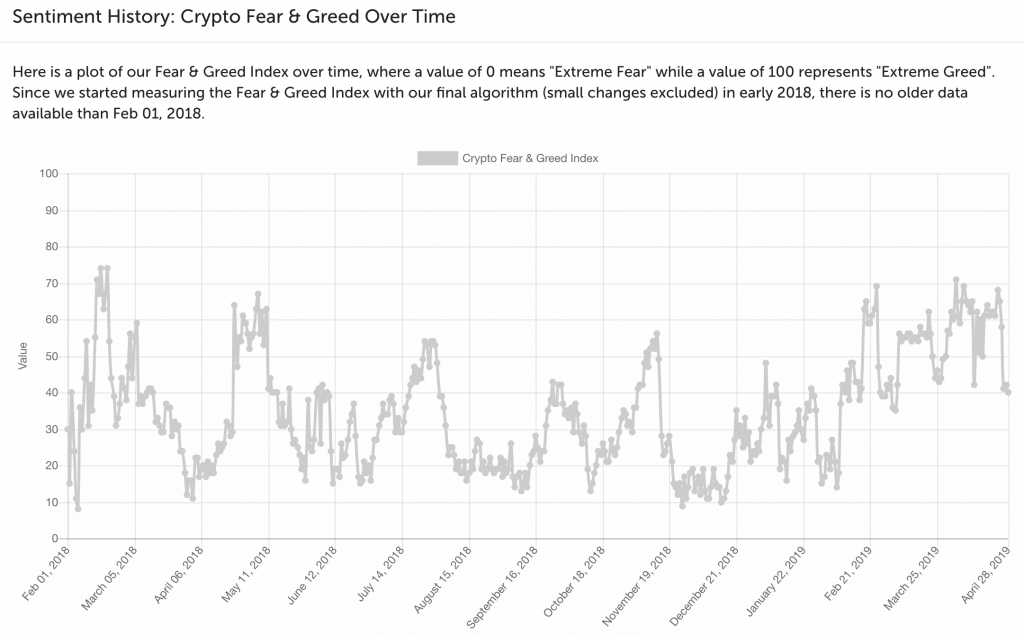
The Crypto Fear and Greed Index (above) is looking very interesting.
Today we are at a 40 which is the lowest value we have seen since the middle of March. 40 is an interesting place to pull back to because it appears that a temporary top is in. The crypto market has been greedy since February 2019 and when the market remains greedy for a substantial period of time it is indicative of a price top. Every time the index has reached above 50, a drop below 20 has followed shortly afterward.
Subsequently, every time the Crypto Fear and Greed Index has dropped into the 20s, sentiment rebounds with explosive bullish price action. This historic behavior fits the narrative of a price pullback to $4.1k, followed by the start of a bull market. While historic performance is not always predictive of future performance, the Crypto Fear and Greed Index may be something you want to consider in your own psychological analysis.
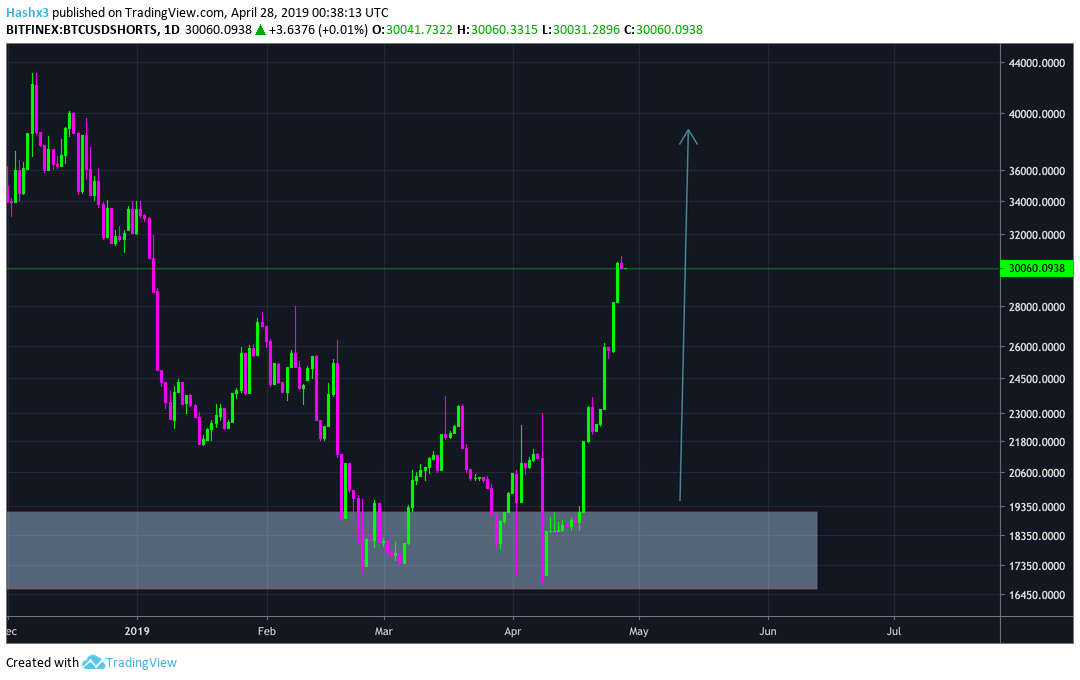
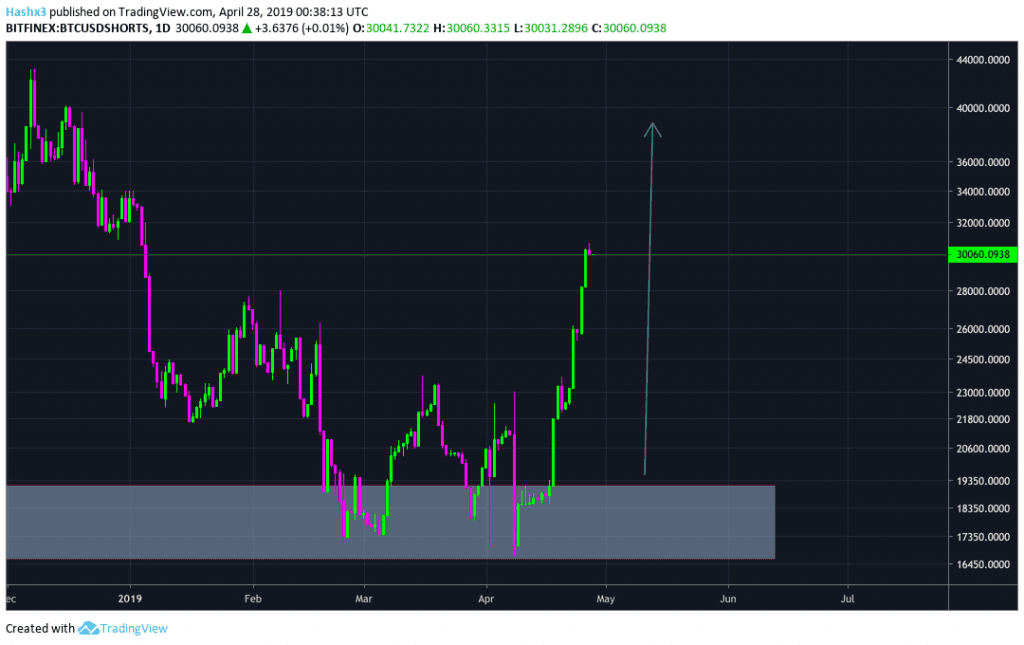
While many indicators are presenting bearish signals, the market is looking ripe for a short squeeze as the shorts are stacking up on the chart above.
Conclusion
Overall, a further pullback and even a retest of $4k would be incredibly healthy for the bullish thesis and would add further evidence that a bottom is in. If we go above $5.5k there is also a very high likelihood that Bitcoin has bottomed. Additionally, a rise above $5.6k would be incredibly bullish considering the negative news we experienced earlier in the week regarding Bitfinex and Tether. If we break below the $4k support level back into the $3000’s, the bulls will have their work cut out for them. Now is the time to begin accumulating Bitcoin. If you have held Bitcoin all the way down it is definitely not the time to sell. While it may not be the exact to buy, it is certainly not the time to sell your Bitcoin. If anything, the time to sell your Bitcoin was in the summer before the drop below $6k.
Disclaimer: I am not a financial advisor. Nothing in this article should be considered financial advice. Please do your own research and make objective decisions. The author of the article owns Bitcoin.