
Cryptocurrency
Bitcoin’s Next Bullish Target is $9.4k
Bitcoin’s Next Bullish Target is $9.4k After blowing past $8.3k, Bitcoin’s next bullish target is $9.4k. In a previous article, we highlighted the ascending triangle Bitcoin experienced at a price of roughly $8k. We noted that ascending triangles have a 70% chance of breaking to the upside, so in retrospect, it’s no surprise price increased […]

Bitcoin’s Next Bullish Target is $9.4k
After blowing past $8.3k, Bitcoin’s next bullish target is $9.4k. In a previous article, we highlighted the ascending triangle Bitcoin experienced at a price of roughly $8k. We noted that ascending triangles have a 70% chance of breaking to the upside, so in retrospect, it’s no surprise price increased to $8.8k. We also said, ‘if resistance at $8.3k is broken, look for a bullish swing trade to $9k-$9.4k.’ Long traders who took this play may want to take some profit, however, price is still bullish in the interim and $9.4k remains a realistic target.
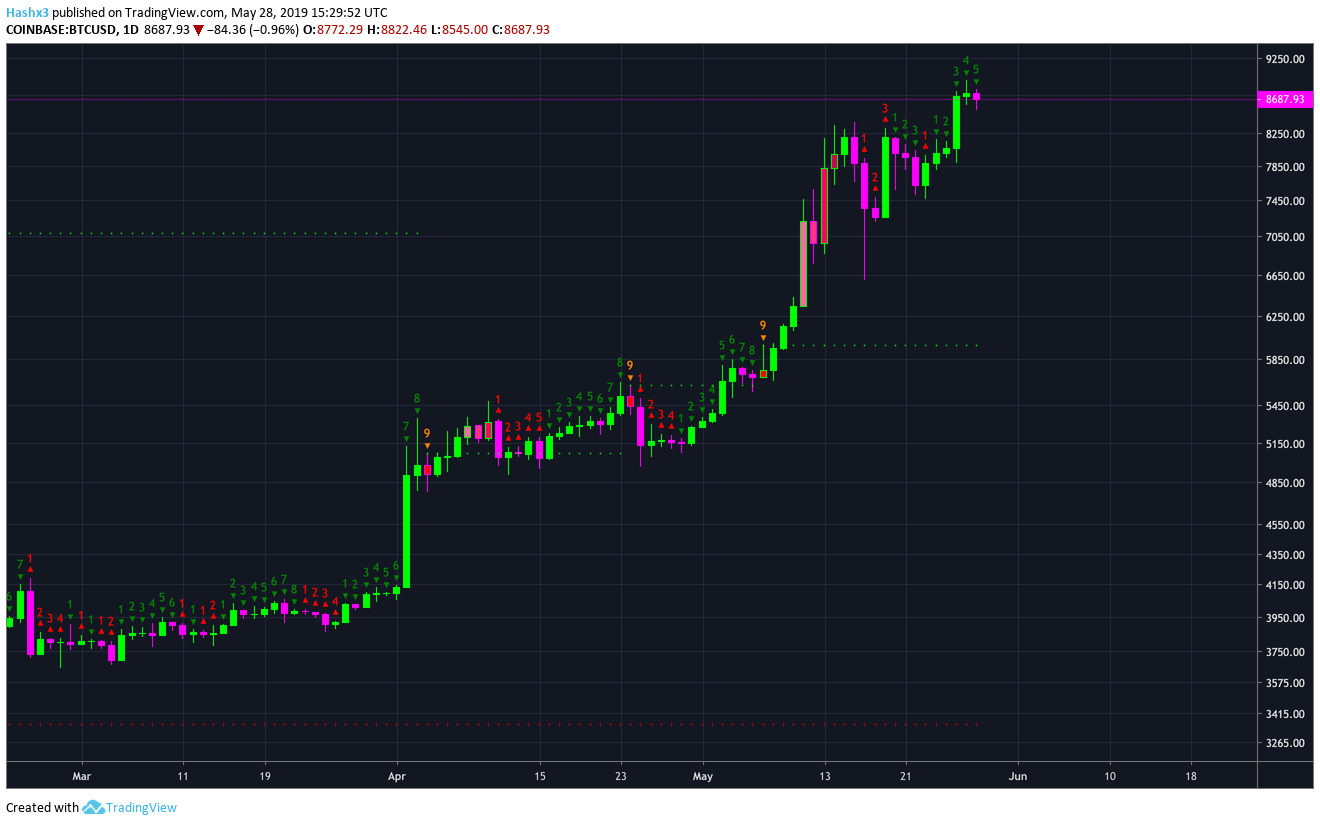
Daily
Looking at the daily chart above, Bitcoin is on a green 5 of 9 candle and looks to have more short-term upside. After pulling back from $8.8k, Bitcoin is now forming a bull flag pattern. If we extrapolate the bull flag pattern onto our current price, it gives us a target of $9.4k. $9.4k is also our critical resistance level and 0.382 fibonacci level.
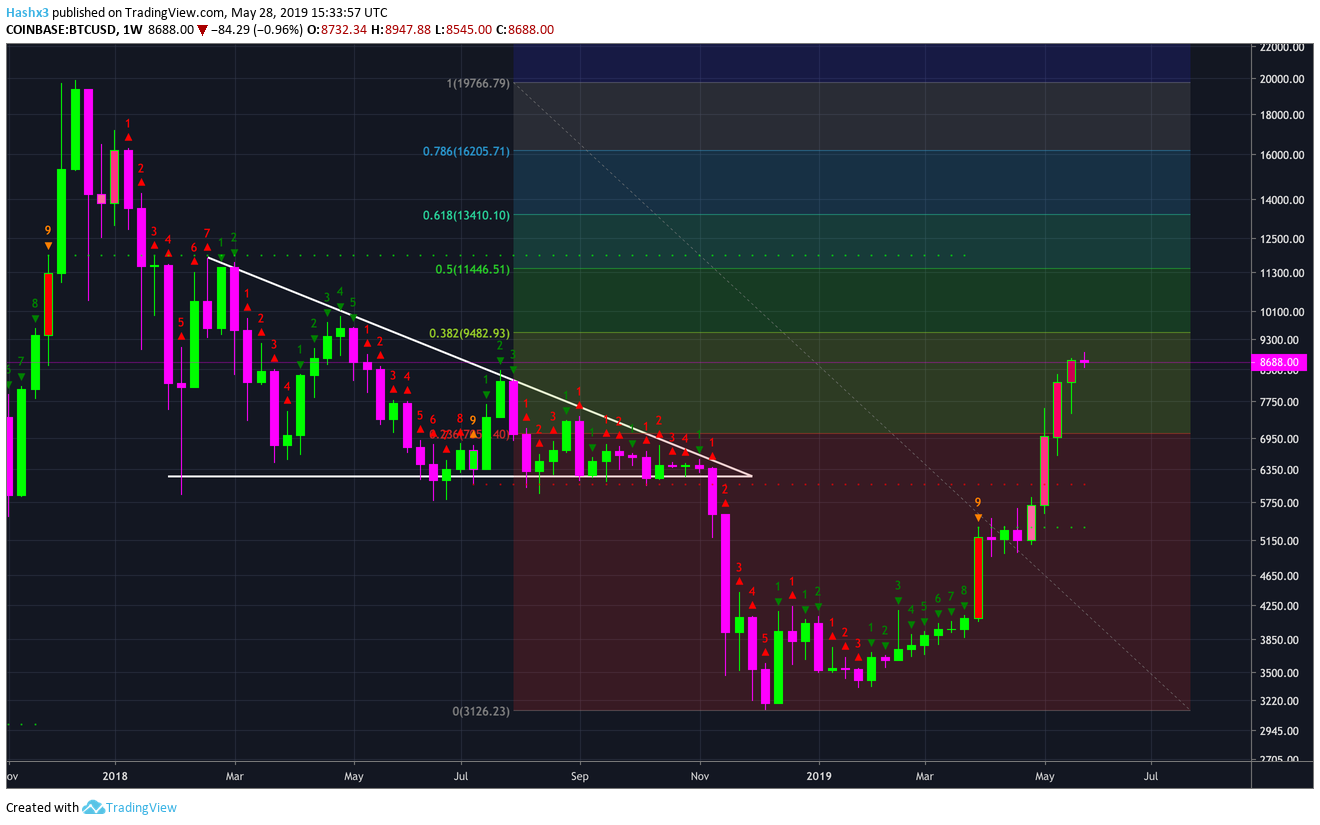
Weekly
The weekly chart is currently on a green 8 of 9 candle. From a macro perspective, there should be a potential trend reversal when we make a green 9 on the weekly chart one week from now. Since our parabolic rise to $8.8k, there hasn’t been a single pullback. In trading, nothing goes up forever without coming down temporarily. While the price increase has been favorable for hodlers, a healthy pullback still needs to come. If the pullback doesn’t come before $9.4k, then price has a decent chance of going straight into the $10k-$12k price channel.
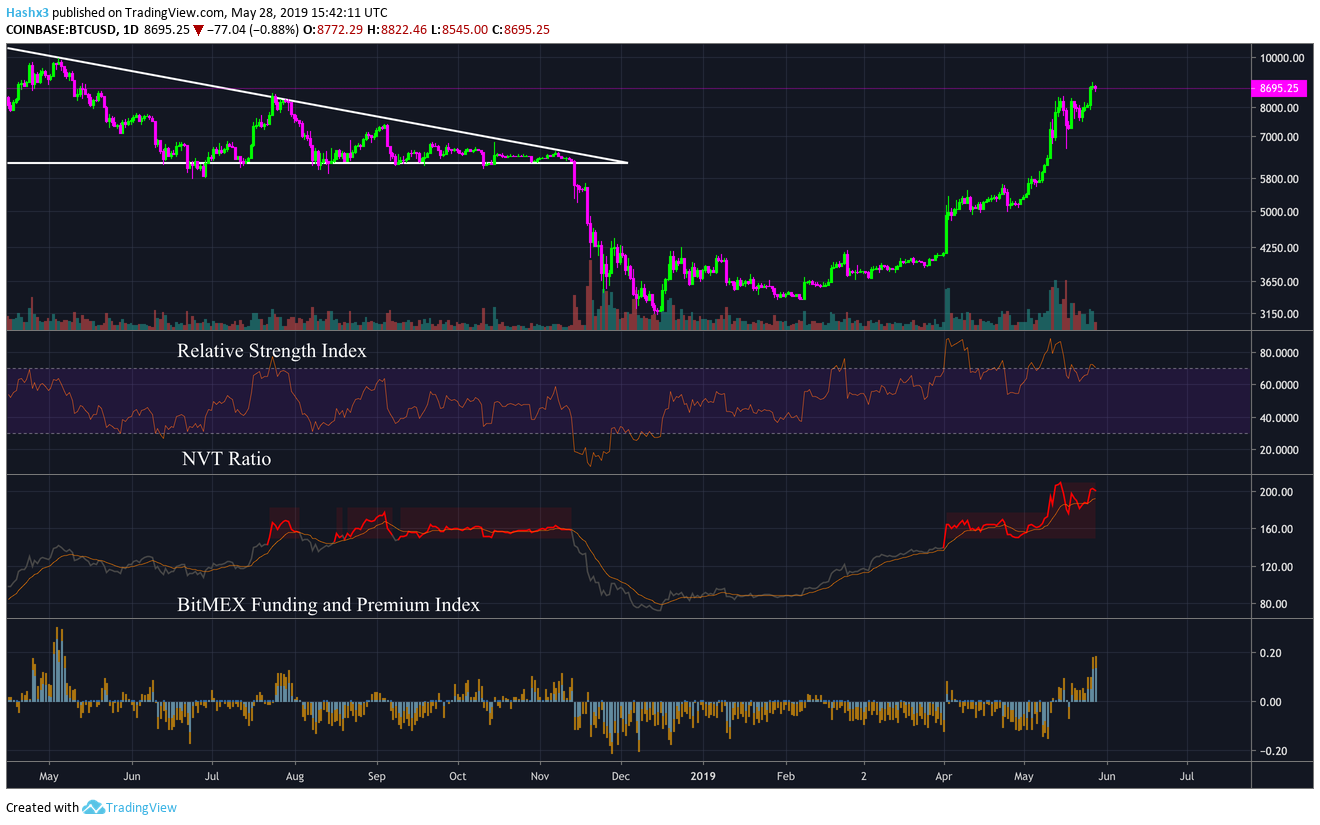
Oscillators
All of our oscillators are currently in overbought territory. That being said, these oscillators have been telling us Bitcoin was overbought since $6k. First, Bitcoin’s daily RSI has now come back to 70 and is slightly overbought.
Below is Bitcoin’s NVT Ratio which we have been monitoring for months now. Before Bitcoin crashed from $20k, Bitcoin’s NVT Ratio went into red zone territory. The same thing occurred before Bitcoin broke below $6k, and currently Bitcoin’s NVT Ratio has been in red zone territory since the beginning of our current rally. It’s difficult to know when, but Bitcoin’s NVT Ratio is telling us there will be a severe pullback before Bitcoin makes new highs.
Lastly is the BitMEX Funding and Premium Index. @NeoButane’s BitMEX index has been an accurate counter-indicator for the past year. Currently, the index flipped into positive territory which signifies a pullback is likely coming.
Conclusion
Bitcoin’s next bullish target is $9.4k. Other than price action, there hasn’t been significant news since last week. Currently, Bitcoin is in a potential bull flag formation which is targeting $9.4k. If price breaks above the 0.382 fibonacci level at $9.4k, look for a bullish swing trade into the $10k-$12k price channel. Bitcoin could see more mainstream media attention and record new all-time highs if price reaches these levels. Look for a potential pullback if price is rejected by the $9.4k resistance level. Additionally, Bitcoin’s weekly sequential indicator will make a green 9 next week. Therefore, expect a possible trend reversal during that time. It is hard to say when, but our oscillators have been foreshadowing a significant pullback for weeks now.
Disclaimer: Nothing in this article should be considered financial advice. The author of the article owns Bitcoin.