
Cryptocurrency
Trading Bitcoin: Bullish Momentum to $14k?
Bullish Momentum to $14k? In yesterday’s article we noted that a green 2 closing above a green 1 is an indication to take a long trade. If you decided to take this trade, you had the opportunity to take a 7% profit yesterday. If you hadn’t taken profit, you’d still be in a winning position. […]
Bullish Momentum to $14k?
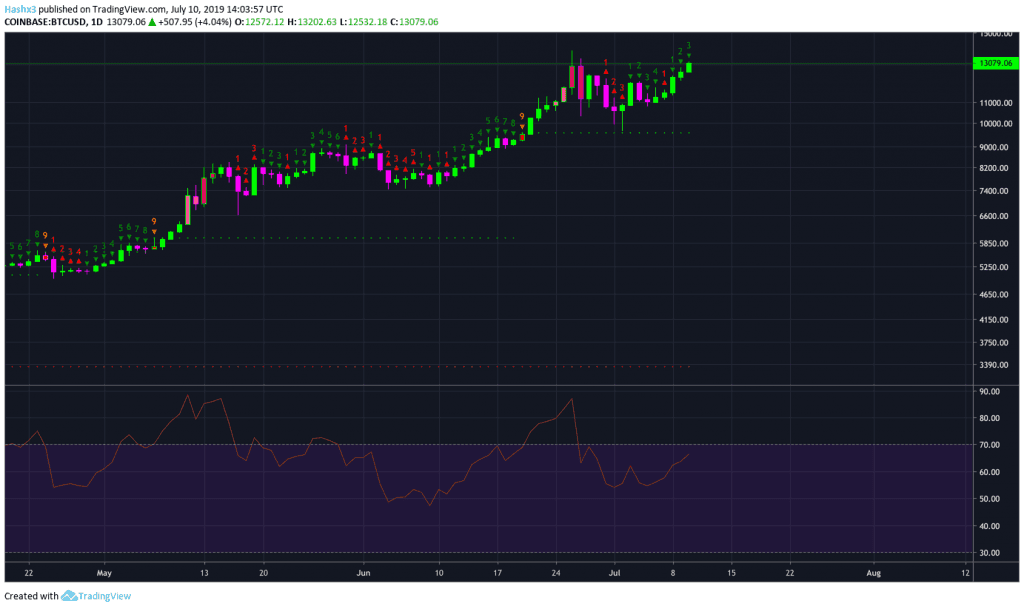
In yesterday’s article we noted that a green 2 closing above a green 1 is an indication to take a long trade. If you decided to take this trade, you had the opportunity to take a 7% profit yesterday. If you hadn’t taken profit, you’d still be in a winning position. The sequential indicator on Bitcoin’s daily chart is on a green 3 of 9 candle. Therefore, price is still bullish with the next major resistance level at $13.3k. Additionally, Bitcoin’s daily RSI is in a bullish divergence and is not yet in overbought territory.
4 Hour
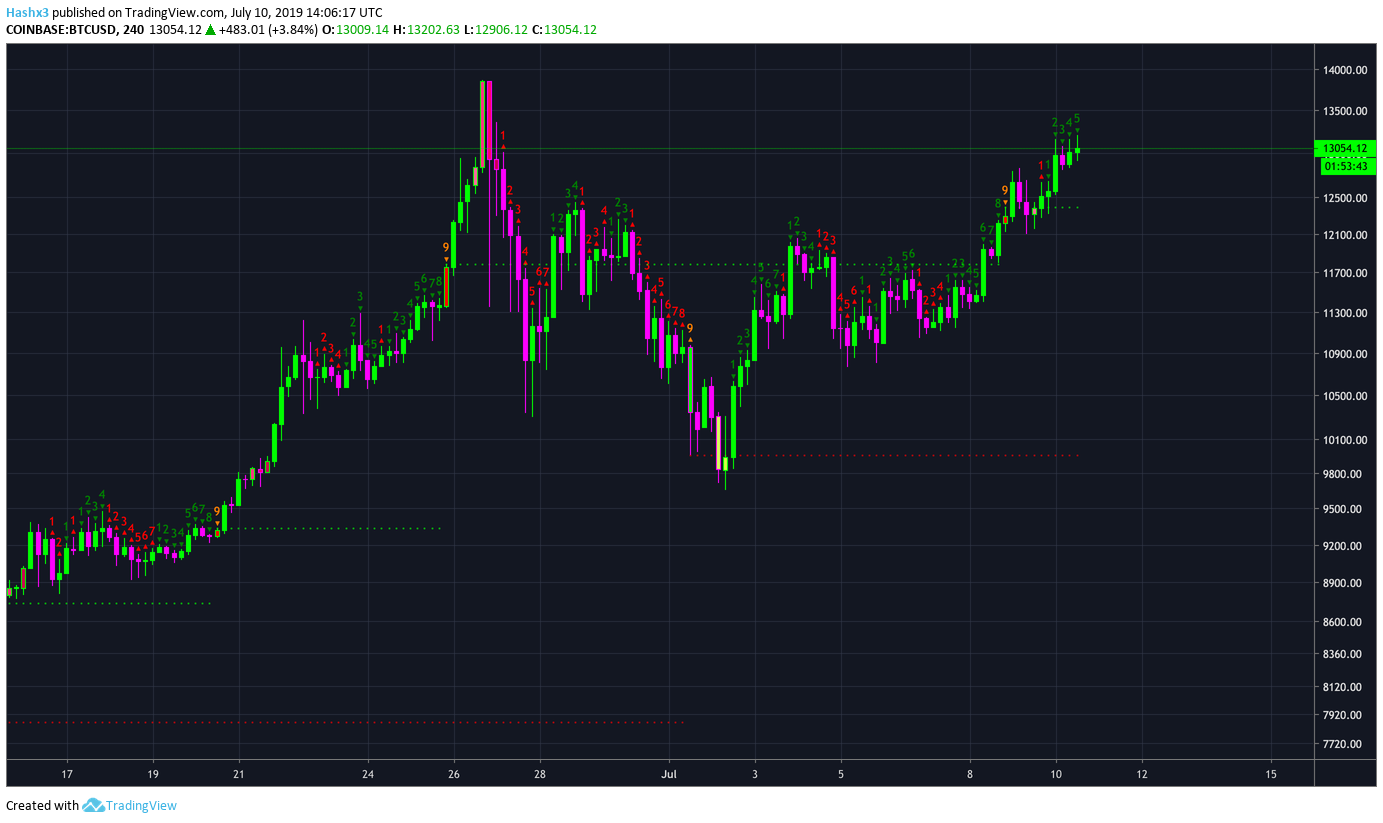
Bitcoin’s 4 hour chart is on a green 5 of 9 candle with more bullish potential coming in the short term. If price reaches a green 9 in 16 hours, we’ll have to reevaluate the momentum of the 4 hour chart. For now, the 4 hour remains bullish.
BitMEX Funding and Premium Index
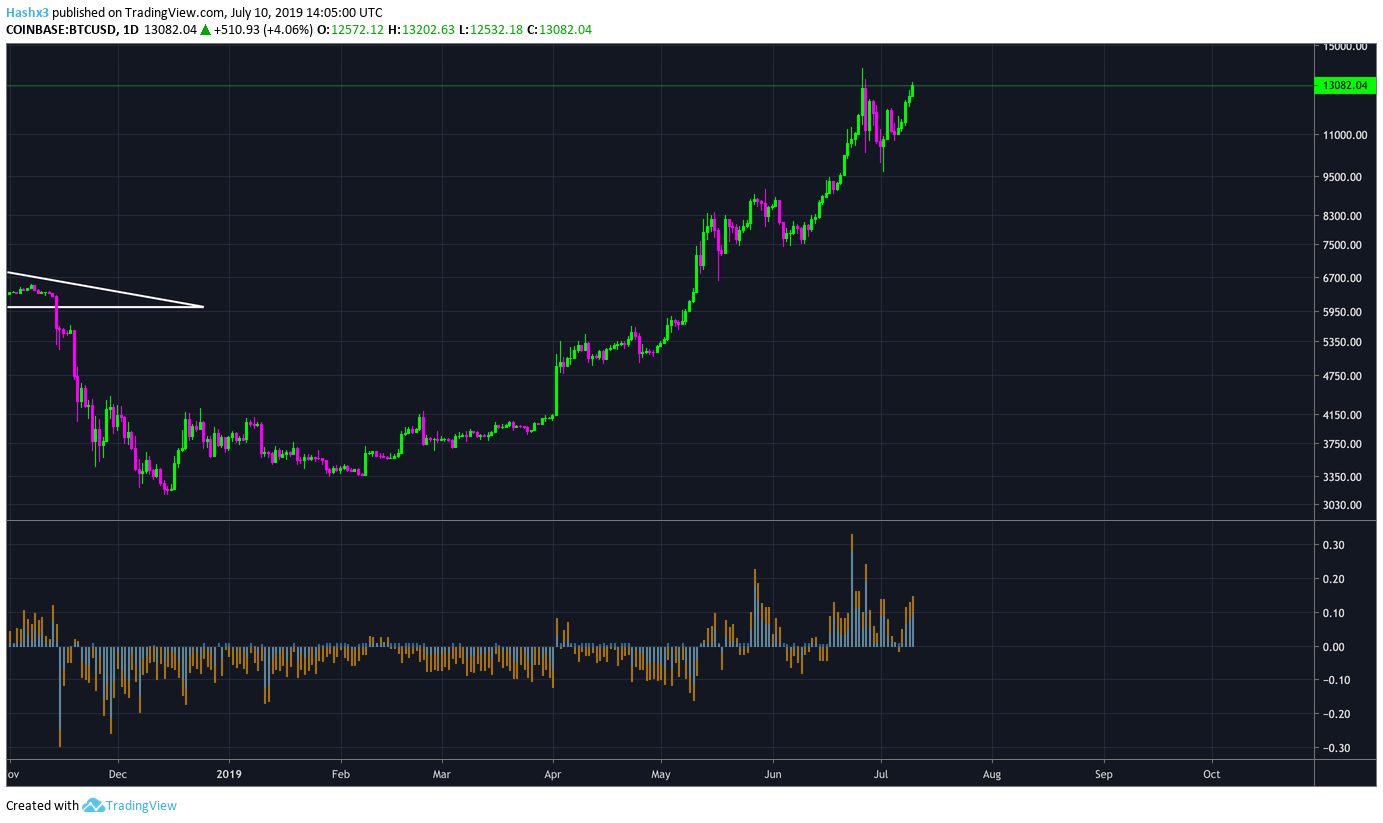
Above is a chart of Bitcoin and the BitMEX Funding and Premium index. The index has been a fairly reliable counter-indicator throughout 2018-2019. While the sequential indicator is providing us with bullish signals, the Funding and Premium Index has been giving us bearish signals since $8k.
Monthly
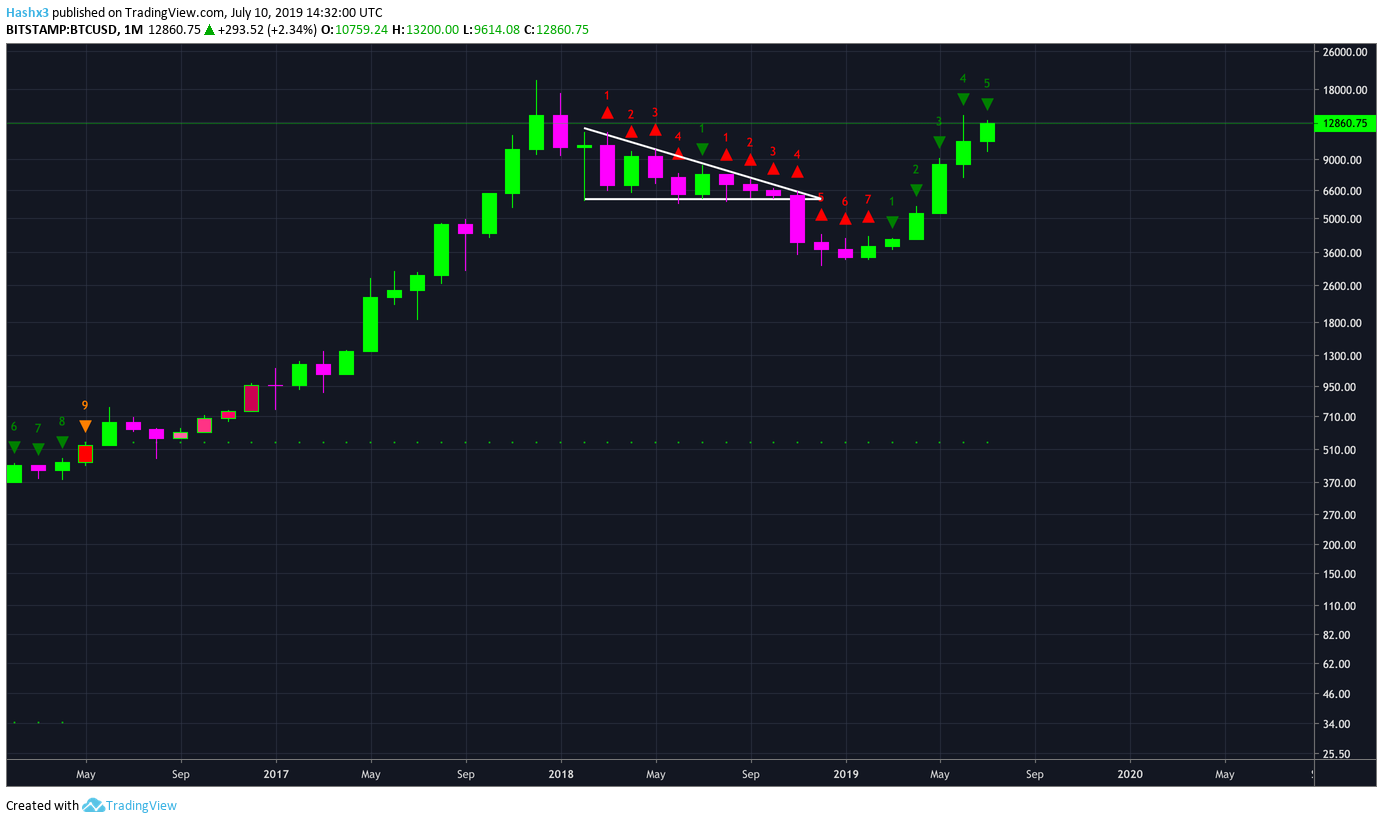
Although oscillators such as the NVT Index and the BitMEX Funding and Premium Index have been overextended since $8k, Bitcoin’s monthly sequential indicator is on a green 5 of 9 candle. Moreover, sequential theory is telling us that Bitcoin will likely have 4 more months of upside before a new sequence is initiated. Therefore, Bitcoin may be entering a hyperwave market cycle which would take us to $40k by the end of 2020. Additionally, the sequential indicator on Bitcoin’s quarterly chart (not included) is on a green 2 of 9 candle telling you to take a long trade. Ultimately, Bitcoin is looking very bullish from a macro perspective.
Conclusion
Bullish momentum continues as the sequential indicator remains green across multiple time frames. Bitcoin’s RSI is in a bullish divergence as well. For now, the trend is showing more upside potential with a high likelihood of breaking above the previous high of $14k. Support remains at $12.8k with the first resistance level at $13.3k.