
Cryptocurrency
$6k Bitcoin Market Surge or Massive Bull Trap Incoming?
After a week of fireworks, Bitcoin has begun to consolidate and establish support at $5k. Last week’s price surge led Bitcoin to finally establish its first higher-high since the beginning of the 2018 bear market. Ever since Bitcoin fell from $20k, the bear market has exhibited a continual pattern of lower-highs. Only recently has Bitcoin […]

After a week of fireworks, Bitcoin has begun to consolidate and establish support at $5k. Last week’s price surge led Bitcoin to finally establish its first higher-high since the beginning of the 2018 bear market. Ever since Bitcoin fell from $20k, the bear market has exhibited a continual pattern of lower-highs. Only recently has Bitcoin begun to form higher-lows after bouncing off the yearly low at $3.1k. Now that Bitcoin has finally formed a higher-high, it appears we are at a crossroads between bearish and bullish perspectives.
All across Crypto Twitter excitement is in the air. After sitting idly by for 15 months, many traders are patiently examining Bitcoin’s every move in search of a bearish or bullish confirmation. One popular macro chart below is Bitcoin’s historic weekly RSI which may suggest we have bottomed.
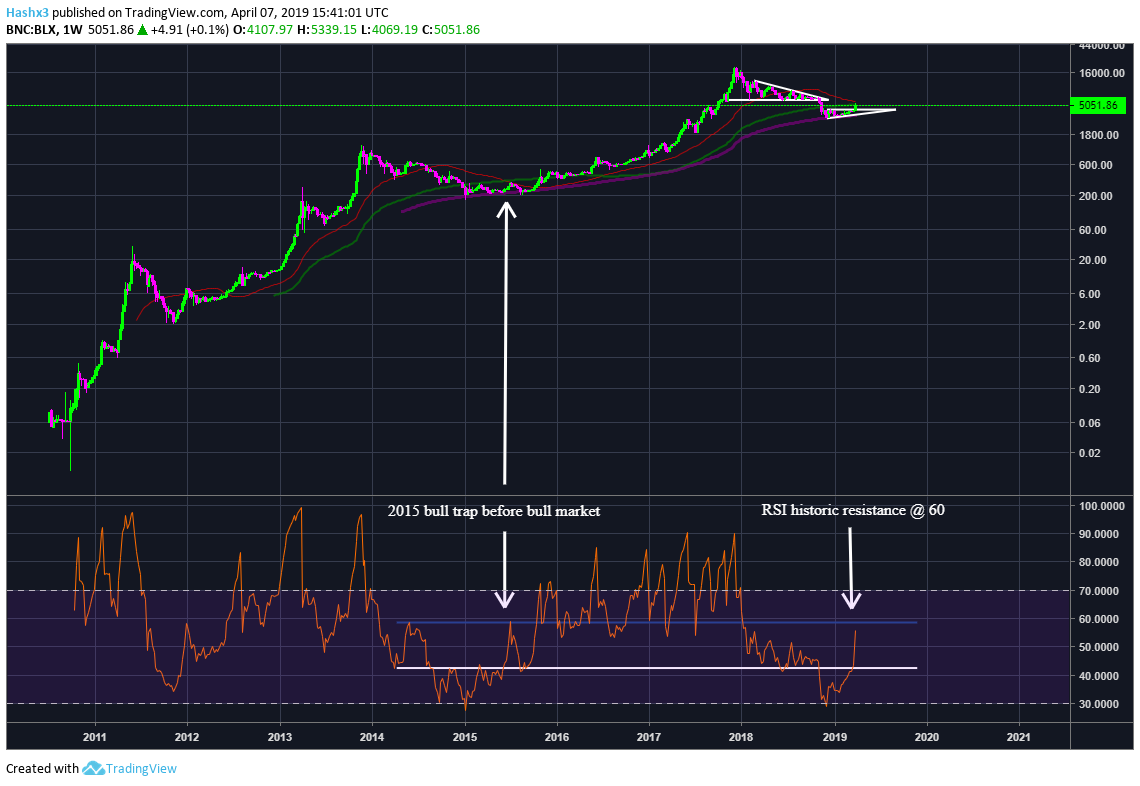
The chart above displays a critical historic RSI level of 40. When the bear market of 2015 ended, one of the first indicators to emerge was the flush break above 40 on the weekly RSI. Last week’s breakout took us above the critical resistance level at 40 and now we are at 58 awaiting a retest of resistance at 60. In 2015, Bitcoin broke above 40 on the weekly RSI, however, it was quickly rejected at 60 which subsequently led to a 40% price drop before a bull market could begin.
This is a very interesting historic bull trap because Bitcoin’s weekly RSI is reaching the same resistance level of 60. If Bitcoin were to be rejected at 60, there would be a 40% price channel downward before retesting the yearly low, the exact same percentage the 2015 bull trap retraced before forming its double-bottom. Historic performance isn’t always an indicator of future price action, nevertheless, it’s ominous if you’re concerned about a bull trap.
A popular bullish chart is the Fibonacci level measured from Bitcoin’s all-time high. Mati Greenspan, senior market analyst at eToro, was one of the first to mention this level in a recent tweet.
“Are you frickin kidding me?! We haven’t even hit the first fib level yet. Drawing the Fibonacci retracement tool from BTC’s ATH, we can see that this leg could easily take us up to $7,000 before hitting the first wall (at 0.236).”
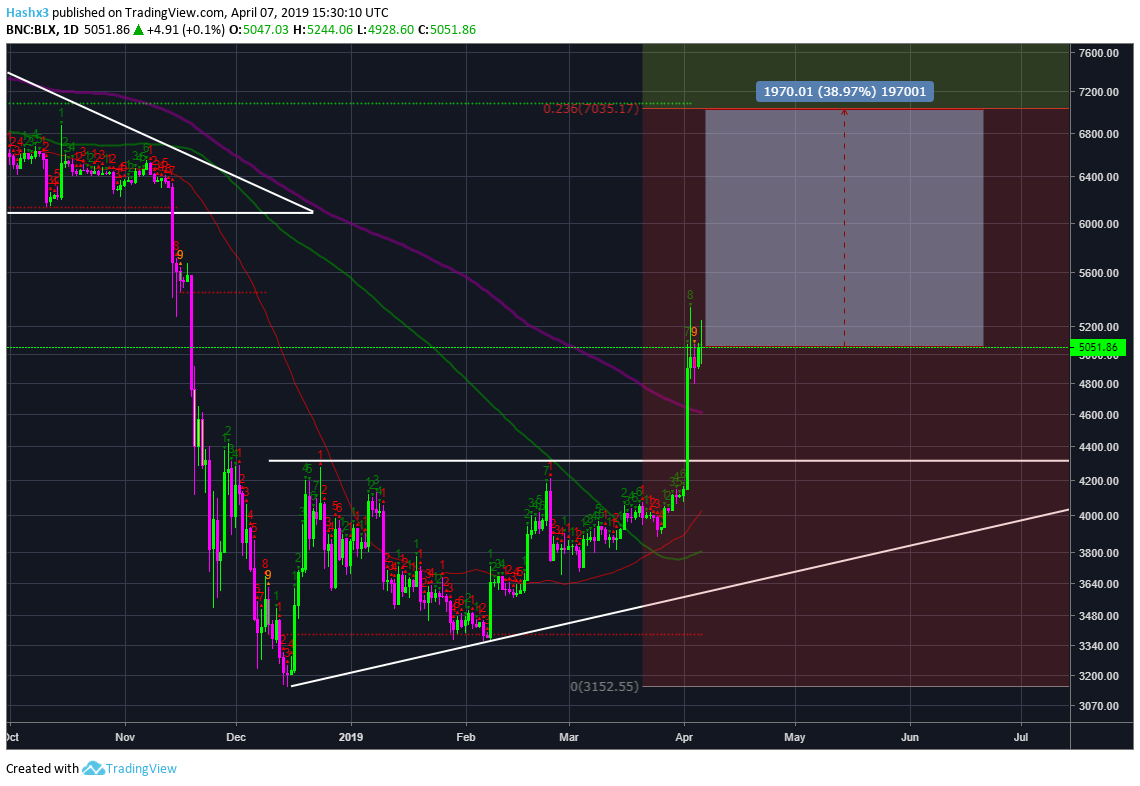
A jump up to $7k would be about a 38% price increase from our current level. One bullish indicator for Bitcoin is the silver cross on the moving averages. Very recently, the 50MA (red) broke above the 128MA (green) which is traditionally characterized as a macro bullish continuation.
The alt coins have been interesting as well. When Bitcoin increased past $5k, it had the largest percentile gain relative to the vast majority of alt coins. If you are looking at Coin Market Cap or a comparable site, rather than looking at dollar percentage gain, it’s more useful to view a coin’s performance relative to Bitcoin. Historically, crypto bull markets begin with Bitcoin leading the way by outperforming most alt coins. Once Bitcoin begins to cool off in the form of single-digit daily percentile gains rather than double-digit daily percentile gains, traders become more confident in the market and start speculating on alt coins. This is when you see people on Crypto Twitter pumping alt coins and claiming, ‘Alt season has begun!’
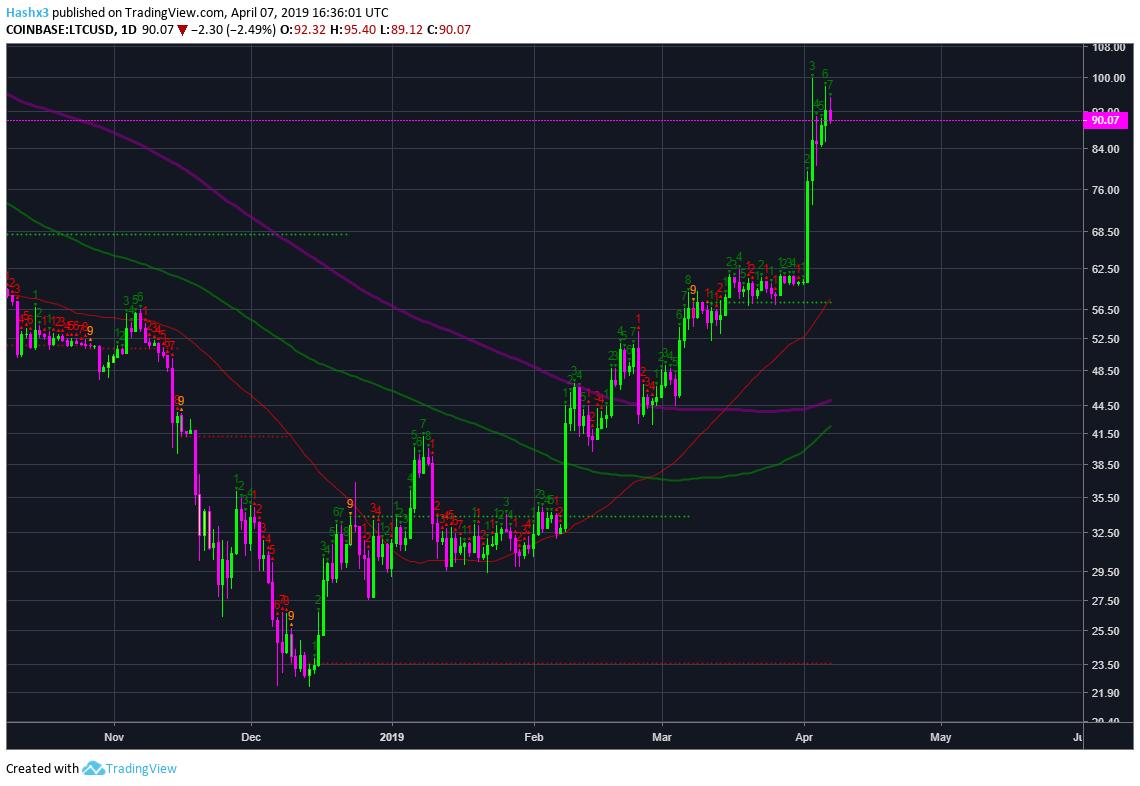
Above is a graph of Litecoin which has seen a substantial price increase this week. Litecoin is one of four cryptocurrencies in the top ten which has formed a golden cross on the daily chart, (EOS, Cardano, and Binance Coin are the other three). A golden cross is a term in technical analysis in which the 50MA (red) crosses above the 200MA (purple). This confirmation typically indicates bullish activity in the foreseeable future. The remaining cryptocurrencies in the top ten (with the exception of Tether) have exhibited a silver cross in which the 50MA (red) has crossed above the 128MA (green). A silver cross is another bullish indicator, but of a lesser degree than the golden cross.
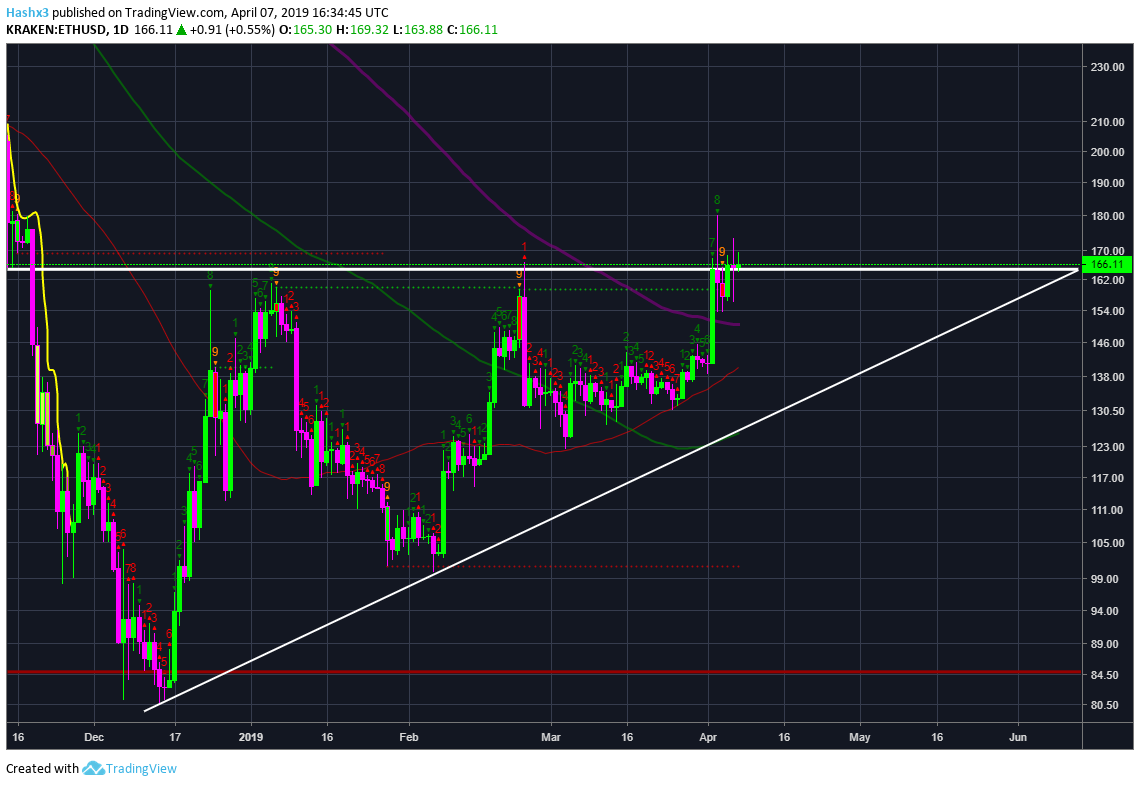
Another interesting alt coin chart is Ethereum. If Bitcoin continues to increase, Ethereum may be an interesting alt coin to monitor because it appears to be in the midst of an ascending triangle formation which hasn’t fully broken out. Ethereum also has strong support levels at $160 in addition to the moving averages below it. Ethereum still hasn’t created a significant higher-high which may suggest it is due for a breakout if Bitcoin’s price action can remain green or neutral at the very least.
Overall, it is still too early to assert whether Bitcoin has bottomed or entered a bull market, however, the existing indicators are fairly promising with the exception of a possible bull trap. Bitcoin’s next resistance level is $5.2k followed by $6k. Current support remains at $5k, $4.8k, and $4.6k.
Disclaimer: This is not financial advice. I am not a financial adviser. Nothing in this article should be considered financial advice. These are observations and opinions on the market. Please do your own due diligence and make objective decisions.