
Cryptocurrency
Bear Flag Patterns Likely to Continue for Bitcoin and Ethereum
During strong upward or downward trends, flag poll patterns occur often. A sharp spike in volume will usually result in a candle in either direction. This is typically followed by a short capitulation period, then a sharp spike in volume leads to further selling pressure. Bitcoin has finally broken into a volatile range which has […]

During strong upward or downward trends, flag poll patterns occur often. A sharp spike in volume will usually result in a candle in either direction. This is typically followed by a short capitulation period, then a sharp spike in volume leads to further selling pressure. Bitcoin has finally broken into a volatile range which has given traders immense opportunity which has not been seen in months. However, there is continual selling pressure as levels drop further. Additionally, this is a period where inexperienced traders may try to ‘buy the dip.’ Unfortunately, buying the dip has not been a very successful strategy in an intense bear market like the one we are currently in. With the lack of historic support levels, there is not much stopping Bitcoin from dropping lower into the $3,500 range. The chart below outlines the historic bear flag patterns seen in Bitcoin’s early capitulation period throughout the spring of 2018.
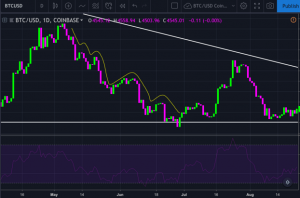
Although it is probable that more bear flags will continue for Bitcoin and the top alt coins, it would not be out of the realm of possibility for Bitcoin’s buying pressure to test the resistance level at $5,000, only to be rejected downward.
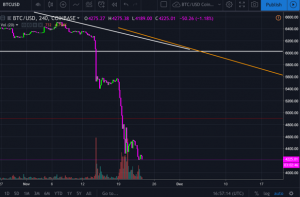
Another significant bearish indicator is the large spike in volume which lead to the sell off earlier this week. The last time the cryptocurrency market experienced similar volume levels was February 2018. This was the start of the first capitulation period of the bear market. It is very bearish to see escalating volume leading to a sell off. Although Bitcoin rebounded on Wednesday from $4,250 to $4,500, the volume was significantly low relative to the selling volume the previous days. Low volume rallies indicate that there is little buying momentum and therefore traders will most likely continue to sell. Low volume rallies are often are followed by high volume sell offs. Either way, it will be exciting to see another large move in Bitcoin, more likely to the downside before the upside.
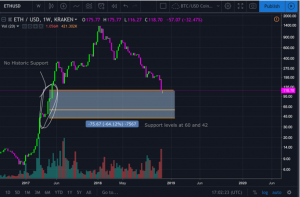
Many of the largest alt coins also have followed this trend. Earlier this week, alt coins experienced a large volume sell off followed by a low volume rally or stagnation. Ethereum has followed this trend quite closely. Currently, Ethereum is in an extremely opportunistic shorting position because there is a 50% channel for which there is no historic support level. Ethereum is trading around $120. The next historic support levels are at $60 and $42. This is a great opportunity for high volatility sell offs and short positions.
Above all, this point must be reiterated: There has not been this kind of opportunity in the cryptocurrency market since November and December of 2017. For traders and fund managers it’s not about surviving a bear market, it’s about thriving in a bear market and profiting off of volatility. There is no excuse to HODL and lose upwards of 10-20% in an extreme bear trend. When it comes to the game of probability and technical analysis, the overall opportunity has already presented itself.
Disclaimer: I am not a financial advisor. This is not financial advice. Please do your research independently and make objective decisions. This article is intended to educate readers on the recent state of the cryptocurrency market. The author of the article trades cryptocurrency.
Image sources from tradingview.com