
Trading Insights
Bearish Engulfing Candle and Bear Flag Breakdown Ahead of FOMC
All four major indices (represented above by their corresponding ETFs: SPY, QQQ, IWM and DIA) generated a bearish engulfing candle this week. In the midst of a choppy market, this isn’t necessarily the end of the world. But when combined with a bear flag breakdown (found in both QQQ and DIA), the market is in […]

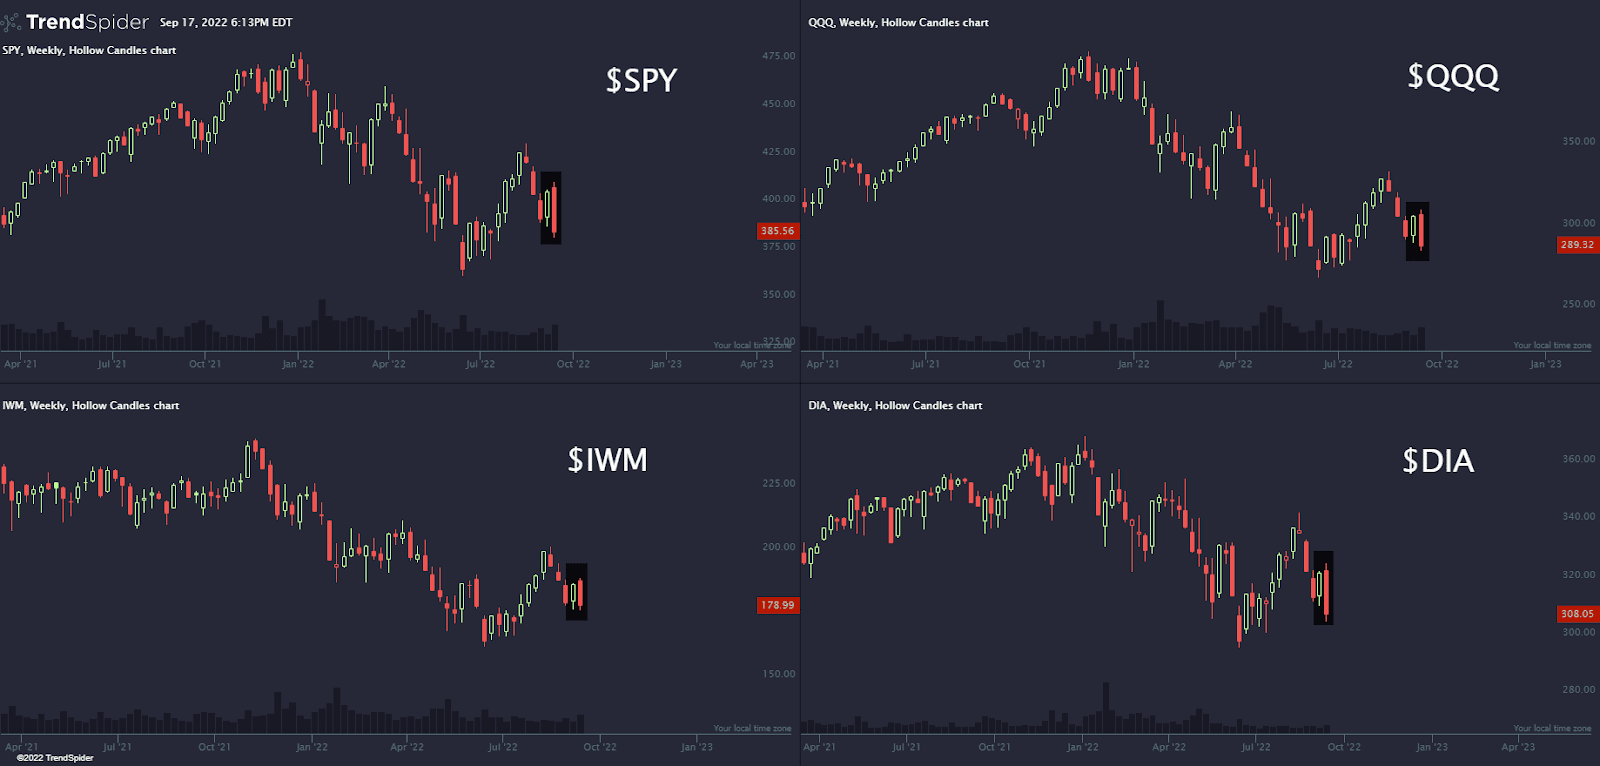
All four major indices (represented above by their corresponding ETFs: SPY, QQQ, IWM and DIA) generated a bearish engulfing candle this week. In the midst of a choppy market, this isn’t necessarily the end of the world. But when combined with a bear flag breakdown (found in both QQQ and DIA), the market is in a relatively weak position ahead of the September 21st FOMC meeting. For bulls, this is a sign to proceed with caution. But for bearish traders, this market weakness alongside a sanguine VIX could present a compelling opportunity.
What is a Bearish Engulfing Candle?
A bearish engulfing candle occurs when two big candles occur back-to-back. The first one is green, the second is red. The first candle presents as a strong upward move, but the second reverses all of the first candle’s gains, with an even larger downward move. To count as a bearish engulfing candle, the body of the second candle must completely engulf the body of the first candle. Bearish engulfing candles indicate that the bears have overpowered the bulls, negating any bullish momentum that could have been generated from the initial bullish move. The larger the second engulfing candle, the more bearish the proceeding move.
The caveat: A bearish engulfing candle is a reversal pattern — and it means much more if it occurs at the top of an uptrend, rather than amid the choppy action that we’ve seen lately. In situations like this, traders should look for additional technical patterns that corroborate the bearish price action before following the signals. In this case, we’re looking at the bear flag that is simultaneously breaking down in QQQ and DIA.
Discover how we use technical analysis to turn breakouts and breakdowns into actionable option trades.
Bear Flag Breaks in QQQ & DIA — But What is a Bear Flag?
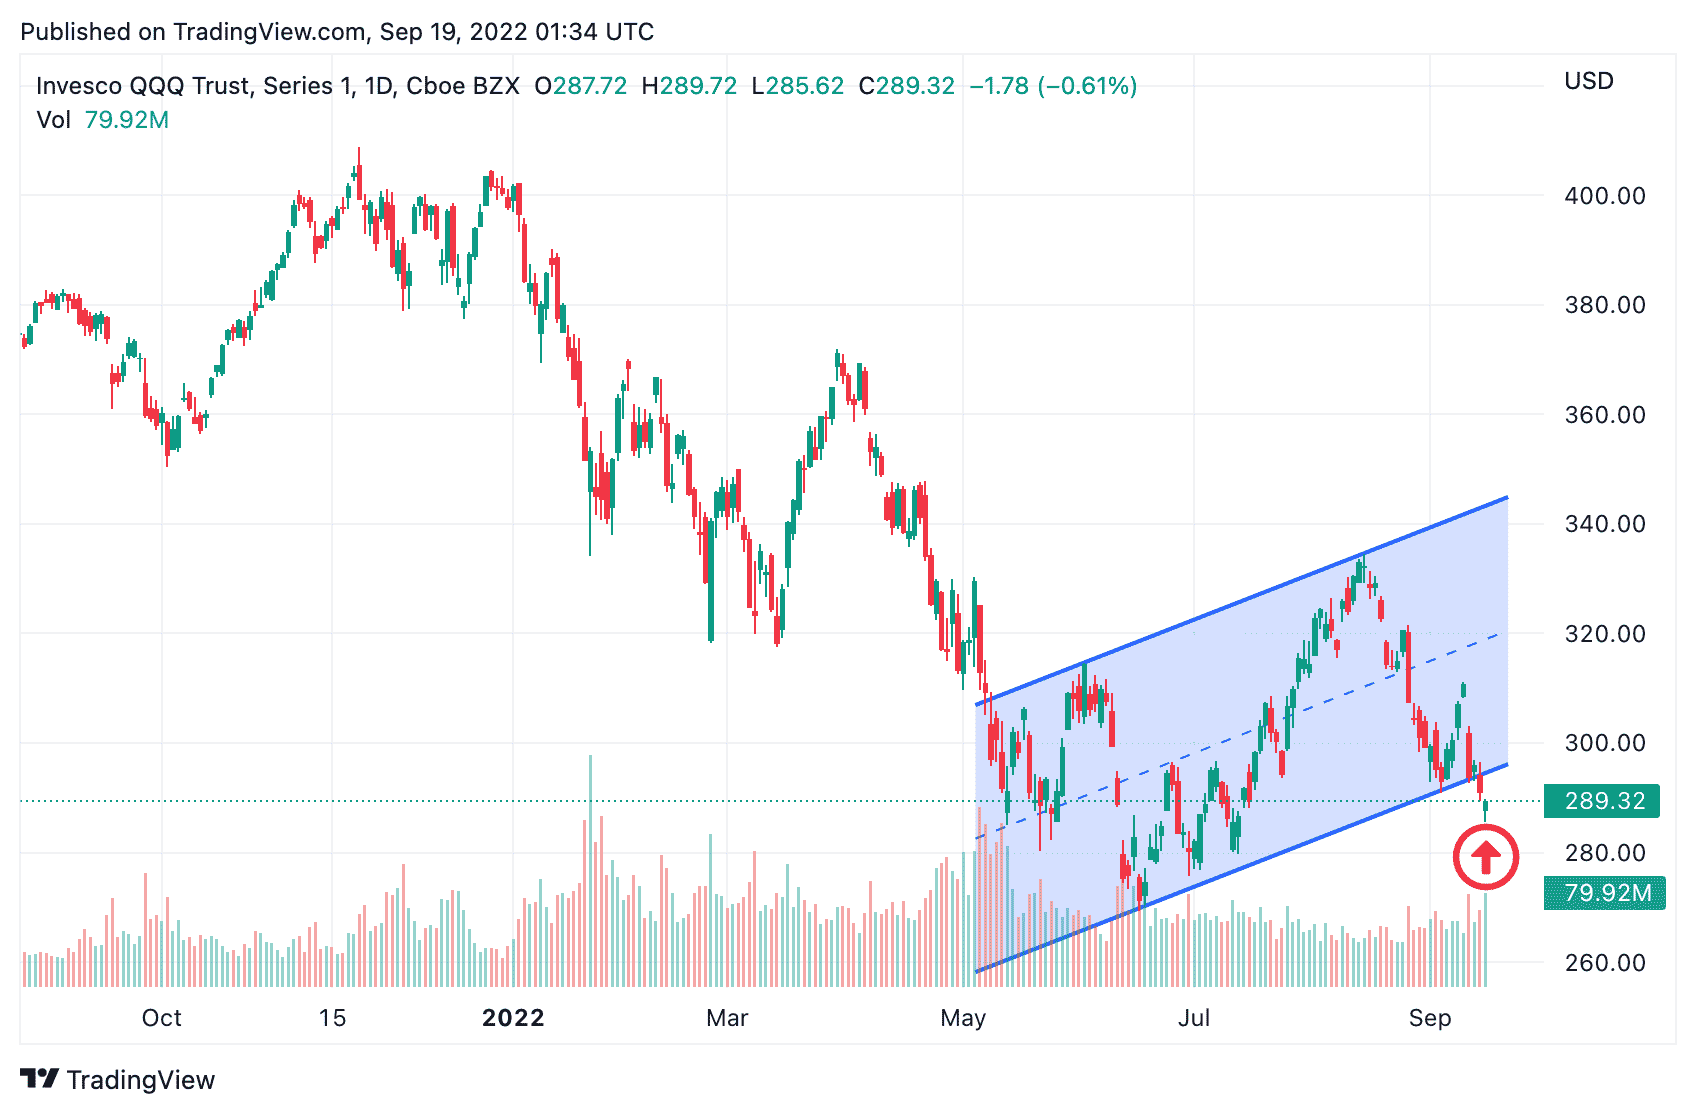
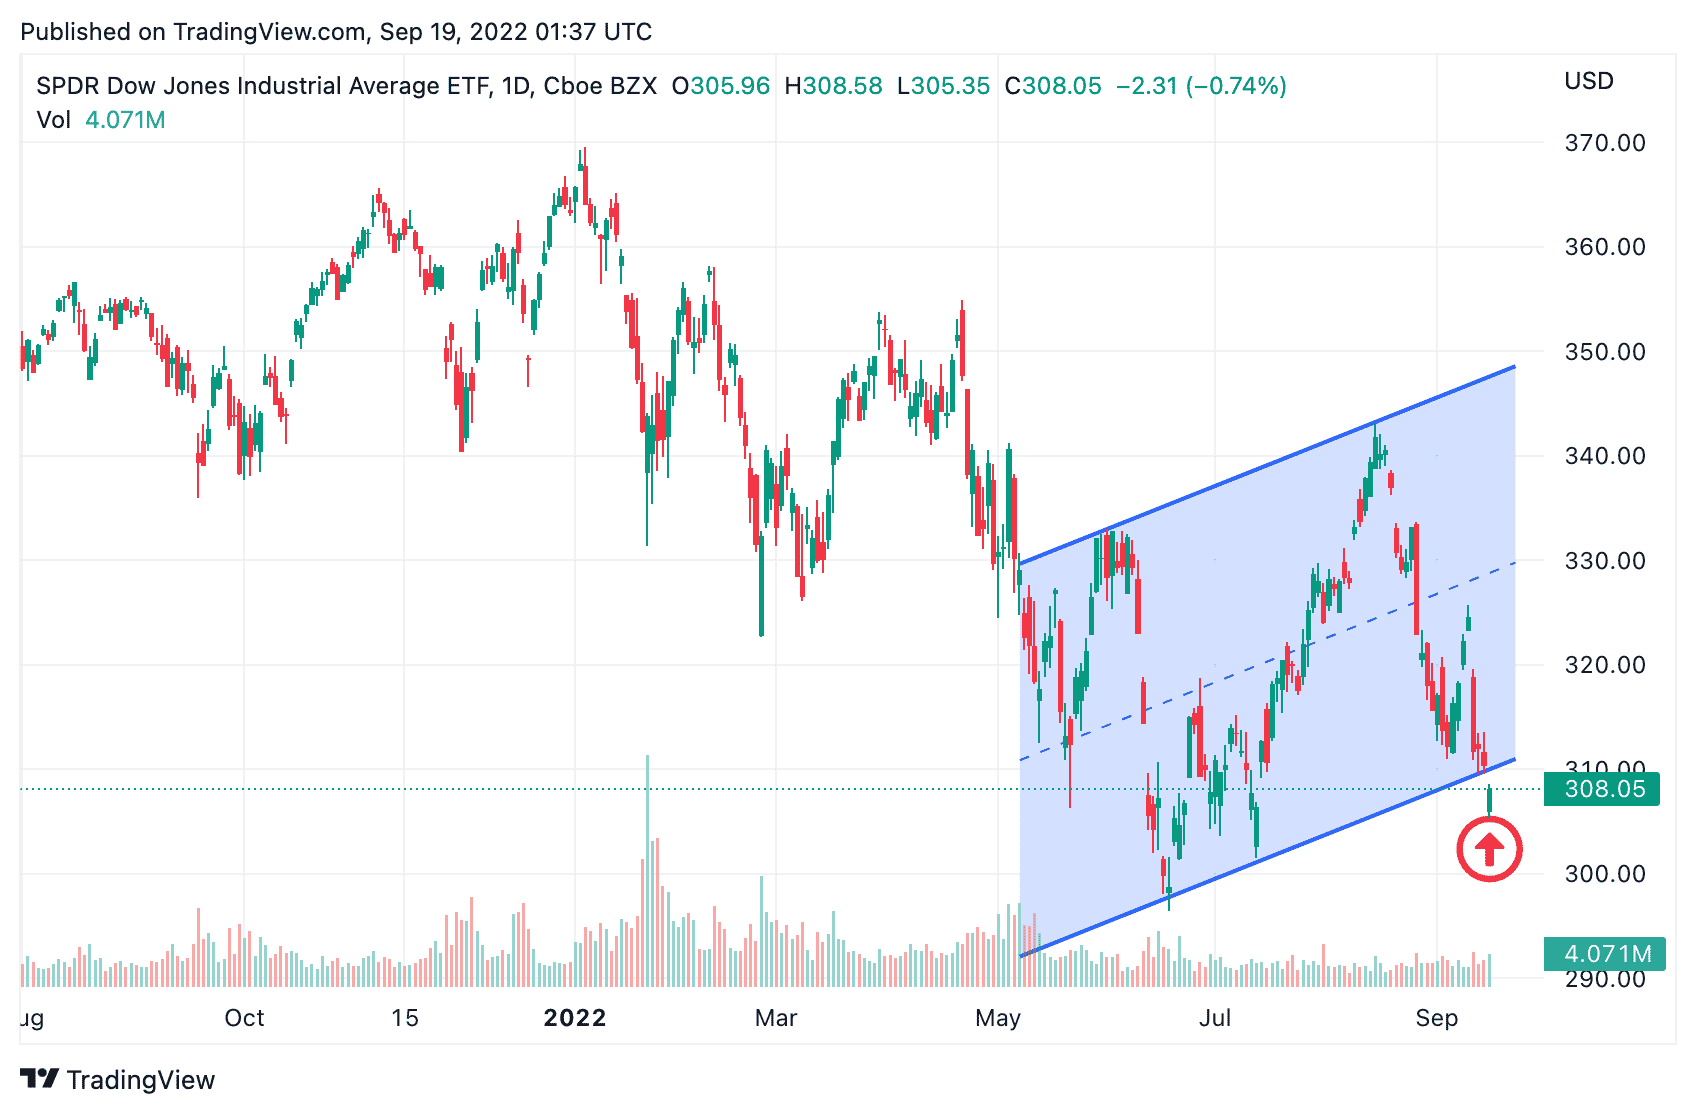
Unlike a bearish engulfing candle, a bear flag is a continuation pattern — meaning that its successful formation often indicates a continuation of the trend previously established. A bear flag is a parallel uptrend that occurs in the midst of a larger downtrend. In order to validate the pattern, price action must break below the upward channel. This breakdown in support against the backdrop of a broader bearish market often leads to a wave of selling, re-establish the downtrend that was in place before the bear flag was initiated.
In the above examples, we see downtrends established in QQQ and DIA beginning in January of 2022, with a series of lower highs and lower lows for a period of months. Then, May begins the formation of an uptrend. If the price action broke above this uptrend, it could have resulted in a bullish breakout — a possible reversal of the broader downtrend. However, it did the opposite, breaking below the bottom trendline of the channel in both instances, thereby validating the bear flag.
Combined with the bearish engulfing candles recently identified in all four major indices, the market is looking weak ahead of the September 21st FOMC meeting. With a sanguine VIX resting almost exactly at its 2022 average, bulls would be smart to proceed with caution, as bearish traders will almost certainly look to take advantage of these technical trade set-ups.
Does Technical Analysis Really Work?
For the uninitiated, it can be easy to blow these technical patterns off as stock market pseudoscience. However, there’s one thing standing in the way: trading algorithms. The AI traders that control more than two thirds of all market volume aren’t trading on fundamentals or feelings. Generally, they’re programmed to make lightning-fast trades based on technical patterns and market events. When the algos detect patterns like bear flags and bearish engulfing candles (specially ahead of high-level catalysts like this week’s FOMC meeting), they’ll often step out of the way in an effort to hopefully avoid additional downside. Their escape velocity can add to bearish momentum, turning technical signals like these into a self-fulfilling prophecy.
The Bottom Line
If you’re a long term investor, you can ignore this whole thing. But if you’re holding a short-term bullish option trade, you’d better be nimble this week. While dovish FOMC speak could create a powerful catalyst for the market, it’s more likely that the recent sky-high CPI Report generates some hawkish headlines. If that happens, and we get more talk about “pain for businesses and households” — more of Powell’s homages to Paul Volcker — more talk of looming recessions the U.S. and abroad — the FOMC meeting is likely to act as a bearish catalyst for a poorly-positioned market.
As they say, “the trend is your friend”, and right now, the trend looks bearish.
