
Cryptocurrency
Bearish Indicators Predict a New Yearly Low For Bitcoin, Likely to Occur Within the Week
Rising wedge patterns are traditionally indicative of trend reversals. In this case, Bitcoin has been exhibiting a textbook rising wedge pattern throughout the past week. According to classical technical analysis, rising wedge patterns will break to the downside 70% of the time. Last week’s reaction rally was likely a result of short sellers taking profit. […]

Rising wedge patterns are traditionally indicative of trend reversals. In this case, Bitcoin has been exhibiting a textbook rising wedge pattern throughout the past week. According to classical technical analysis, rising wedge patterns will break to the downside 70% of the time.
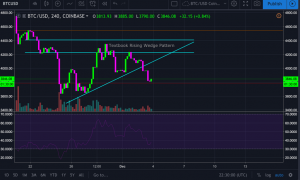
Last week’s reaction rally was likely a result of short sellers taking profit. Since then, bullish momentum appears to be dying as volume continues to stagnate. Throughout last week, Bitcoin was unable to rise through resistance levels at $4,400 and $4,250. Bitcoin has now broken below the trend line support of the rising wedge formation. Bitcoin’s recent move to the downside has been a textbook example of how a rising wedge pattern typically leads to a decrease in price.
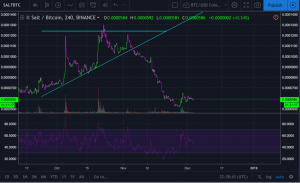
The chart above is another example of how detrimental a rising wedge pattern can be. The altcoin Salt is an extreme example, nevertheless it is a testament to how volatility can create immense opportunity in this market.
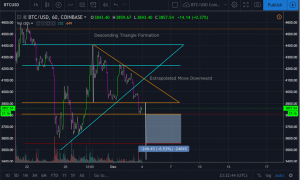
The next chart above includes a significant amount of information which is very bearish for Bitcoin in the short term. Now that the rising wedge formation has broken to the downside, it appears that price has found a temporary support level at $3,800. The orange lines on the chart above outline another descending triangle formation. Per technical analysis, descending triangles break to the downside 70% of the time. Now that the descending triangle formation has been confirmed, Bitcoin’s current support level is $3,800. The white lines on the chart are a measurement from the top of the descending triangle to the bottom of the triangle. If you extrapolate the measured move at $3,900, the white line perfectly matches up with the support level at roughly $3,400. If Bitcoin breaks support at $3,800 – $3,750, expect a downward move of at least 6%. This decline may occur within the week and take us to new yearly lows.
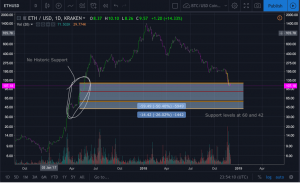
The chart above indicates that Ethereum is still in a volatile zone with very little historic support levels. If Bitcoin breaks its support level at $3,800 and creates new yearly lows at around $3,400, Ethereum may decline to a target of about $85. The price of Ethereum has a significant amount of downward momentum. Additionally, Ethereum’s decentralized applications are struggling to onboard users, which is a whole other discussion in and of itself.
It is critical to trade with the macro trend as it has continued to prevail. If the cryptocurrency market cap drops below 100 billion, it could certainly break a psychological support barrier which will likely create a frenzy of panic and an incredible opportunity for short sellers.
Although it is always important to consider a possible break to the upside, Bitcoin’s technicals are not indicating any bullish momentum at this point. If a rally were to occur, Bitcoin would have to spike upward and break resistance at $4,400 with significant volume. Currently, Bitcoin is experiencing low volume and it looks as if the bulls have lost momentum. The reality of the situation is that Mom and Pop don’t want to buy an asset that is down 80%. Mom and Pop want to buy something that is up 50% with growing momentum. Until a catalyst occurs, the bear market will clean the cryptocurrency space of dumb money, get-rich-quick schemers, and negligent projects.
Disclaimer: I am not a financial advisor. This is not financial advice. Please do your research independently and make objective decisions. This article is intended to educate readers on the recent state of the cryptocurrency market. The author of the article trades cryptocurrency.
Chart Images are from tradingview.com and https://www.investopedia.com/university/charts/charts7.asp