
Cryptocurrency
Bitcoin Analysis with Fibonacci Extensions: Past and Future
Fibonacci levels are an incredibly effective tool when determining the probability of support and resistance levels. Fibonacci extensions can help investors identify when to take a profit or avoid potential losses. The primary ratios in Fibonacci’s sequence are 23.6%, 38.2%, 50%, 61.8% and 100%. The most significant ratios are 61.8% and 23.6%. A 38.2% – […]

Fibonacci levels are an incredibly effective tool when determining the probability of support and resistance levels. Fibonacci extensions can help investors identify when to take a profit or avoid potential losses. The primary ratios in Fibonacci’s sequence are 23.6%, 38.2%, 50%, 61.8% and 100%. The most significant ratios are 61.8% and 23.6%. A 38.2% – 50% range would indicate a moderate retracement, while the 61.8% level is known as the golden ratio.
Scientists and mathematicians have utilized these ratios for centuries. ‘Each term in this sequence is simply the sum of the two preceding terms: 1, 1, 2, 3, 5, 8, 13, and so on’…But what is more significant is ‘the quotient of the adjacent terms, roughly 1.618, or its inverse 0.618.’ The ratio of 1.61 is found throughout all walks of life ranging from the patterns of seeds on a strawberry to ancient greek architecture. Fortunately, for investors, it can also be used to determine a point of action.
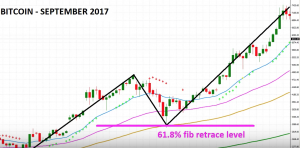
Historically, bitcoin has reacted strongly when prices have declined to the Fibonacci retracement level of 61.8%. During September 2017, the bitcoin bull market experienced a temporary correction which declined to the 61.8% fib level. Once the price of bitcoin reached this resistance point the price rebounded soon after.
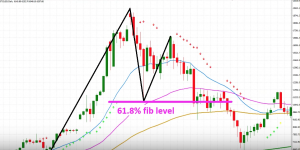
A similar pattern occurred during the bull run of December 2017 and the correction of January 2018. Bitcoin reached a peak and corrected to a resistance point at a 61.8% fib level. Although the price declined substantially throughout the following months, bitcoin did experience a slight run-up after declining to the 61.8 fib level.
Bitcoin experienced a small rally between the end of June 2018 and beginning of July 2018. However, last week bitcoin declined to the critical 61.8% fib level. After falling to a price of $6,180, the price of bitcoin rose to around $6,600. Ever since, bitcoin has consistently fluctuated within the range of $6300-$6600.
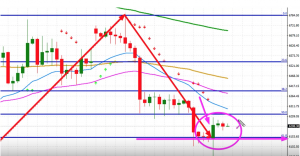
Technical analysis, daily news, and market sentiment are all important factors to consider when attempting to predict the future short-term behavior of bitcoin. Nevertheless, bitcoin has reached an interesting point which could probabilistically lead to a price increase. However, it is also probable that if bitcoin falls below the support level of $6,100 – $6,000, the decline could result in the lowest bitcoin price of 2018.
Disclaimer: This is not financial advice. Please do your own research and make objective decisions. This article is intended to educate readers about Fibonacci Extensions and how they have predicted past prices of bitcoin. The author of the article owns cryptocurrency.
Additional Sources:
https://www.investopedia.com/articles/technical/04/033104.asp
http://stockcharts.com/school/doku.php?id=chart_school:chart_analysis:fibonacci_retracemen
https://cryptoiq.co/
Images / Bitcoin Charts are from Alessio Rastani, available at:
https://www.youtube.com/watch?v=MxvUzYJmVo0&t=497s&ab_channel=AlessioRastani