
Cryptocurrency
Bitcoin Bounces Back to $8.8k
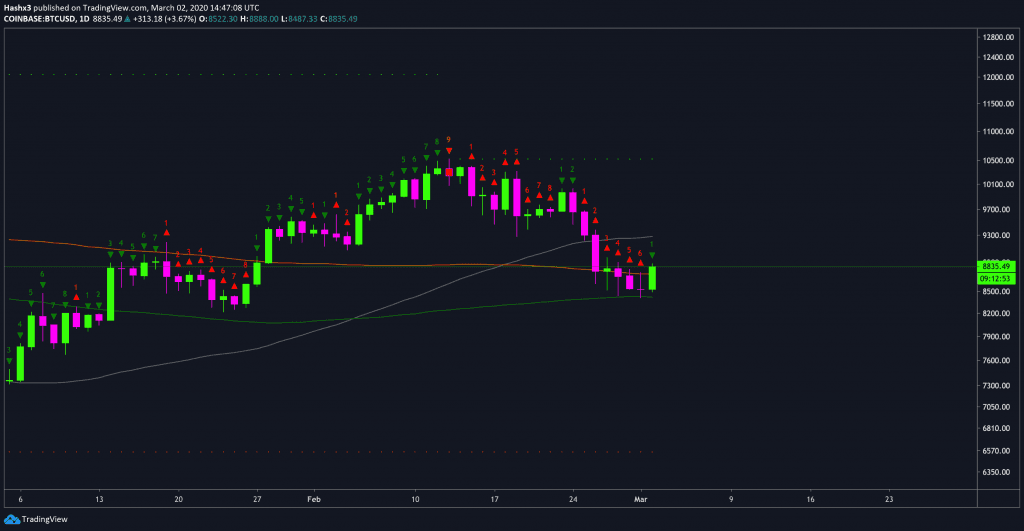
Bitcoin Bounces Back to $8.8k After a week of fear and uncertainty, Bitcoin and the stock market are both in the green today with BTC up 3.7%. After reaching a red 6 on the daily chart, Bitcoin has now undergone a price flip to a green 1. Notably, Bitcoin broke right through the 200MA (orange) […]
Bitcoin Bounces Back to $8.8k
After a week of fear and uncertainty, Bitcoin and the stock market are both in the green today with BTC up 3.7%. After reaching a red 6 on the daily chart, Bitcoin has now undergone a price flip to a green 1. Notably, Bitcoin broke right through the 200MA (orange) which is a significant sign when determining whether the trend is bearish or bullish.
4 Hour
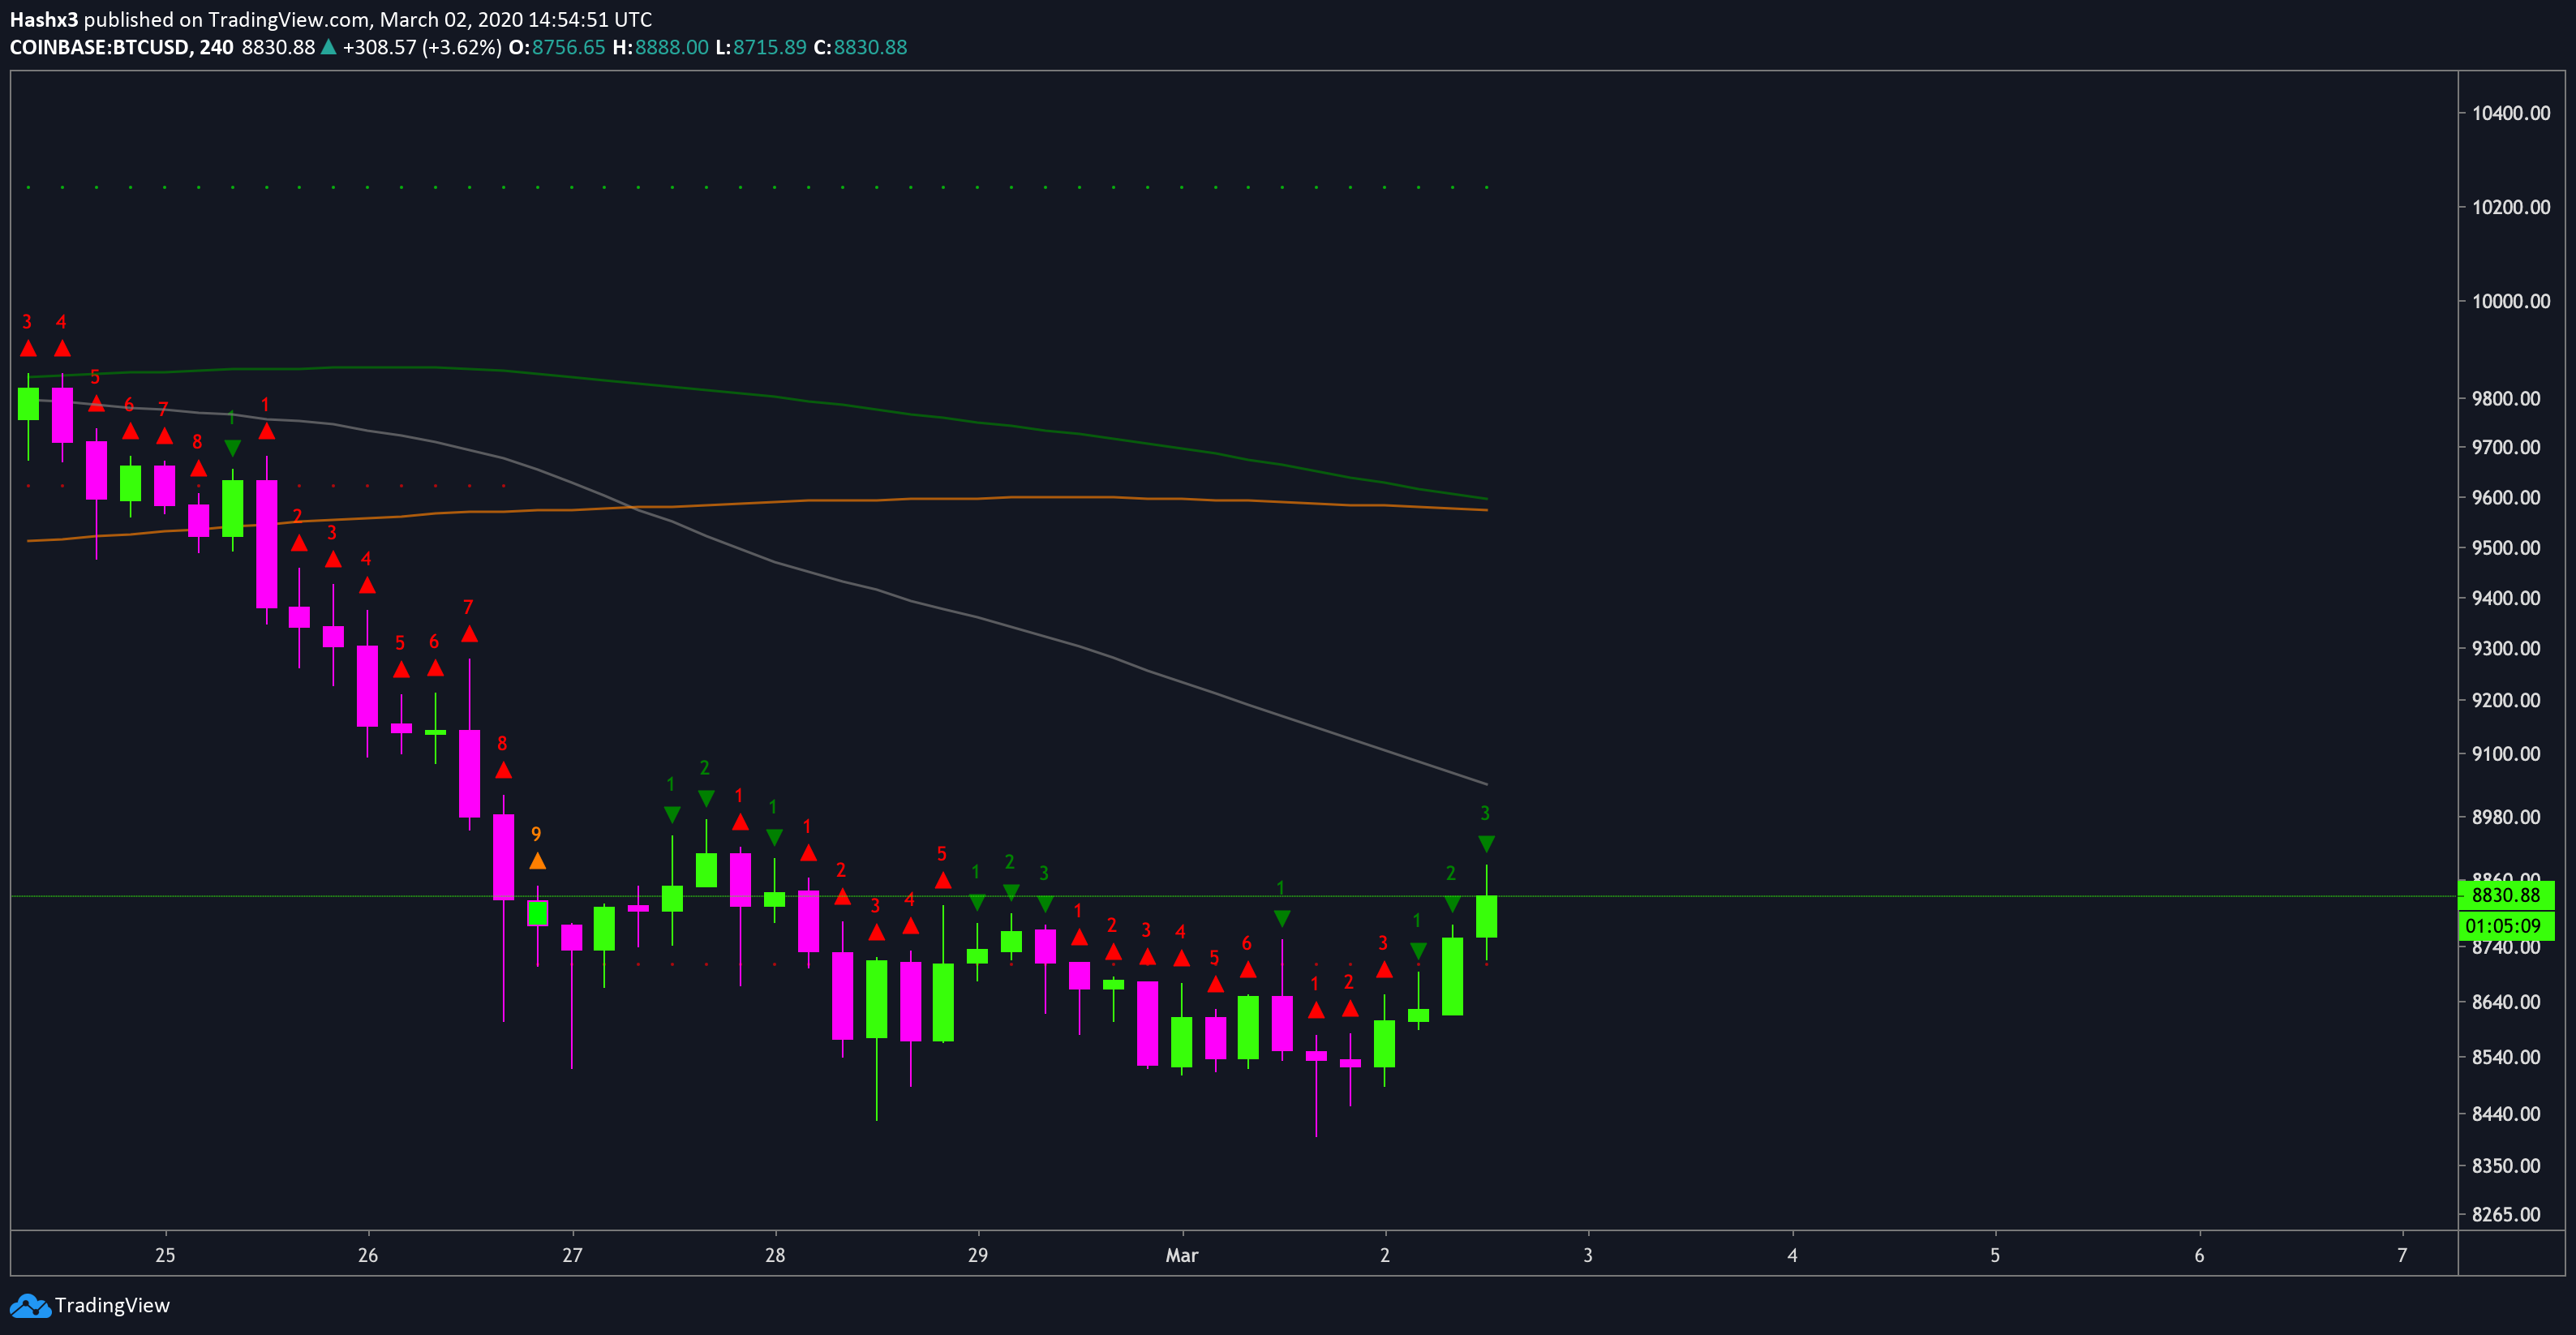
On the 4 hour chart above, Bitcoin is breaking out on the sequential indicator. Currently, we are on a green 3 of 9 candle and are testing resistance at the 50MA (grey). As of now, Bitcoin faces heavy resistance at $9.5k on the 4 hour chart. Both the 128MA and 200MA are forming resistance at $9.5k with the 0.618 fibonacci level.
Weekly
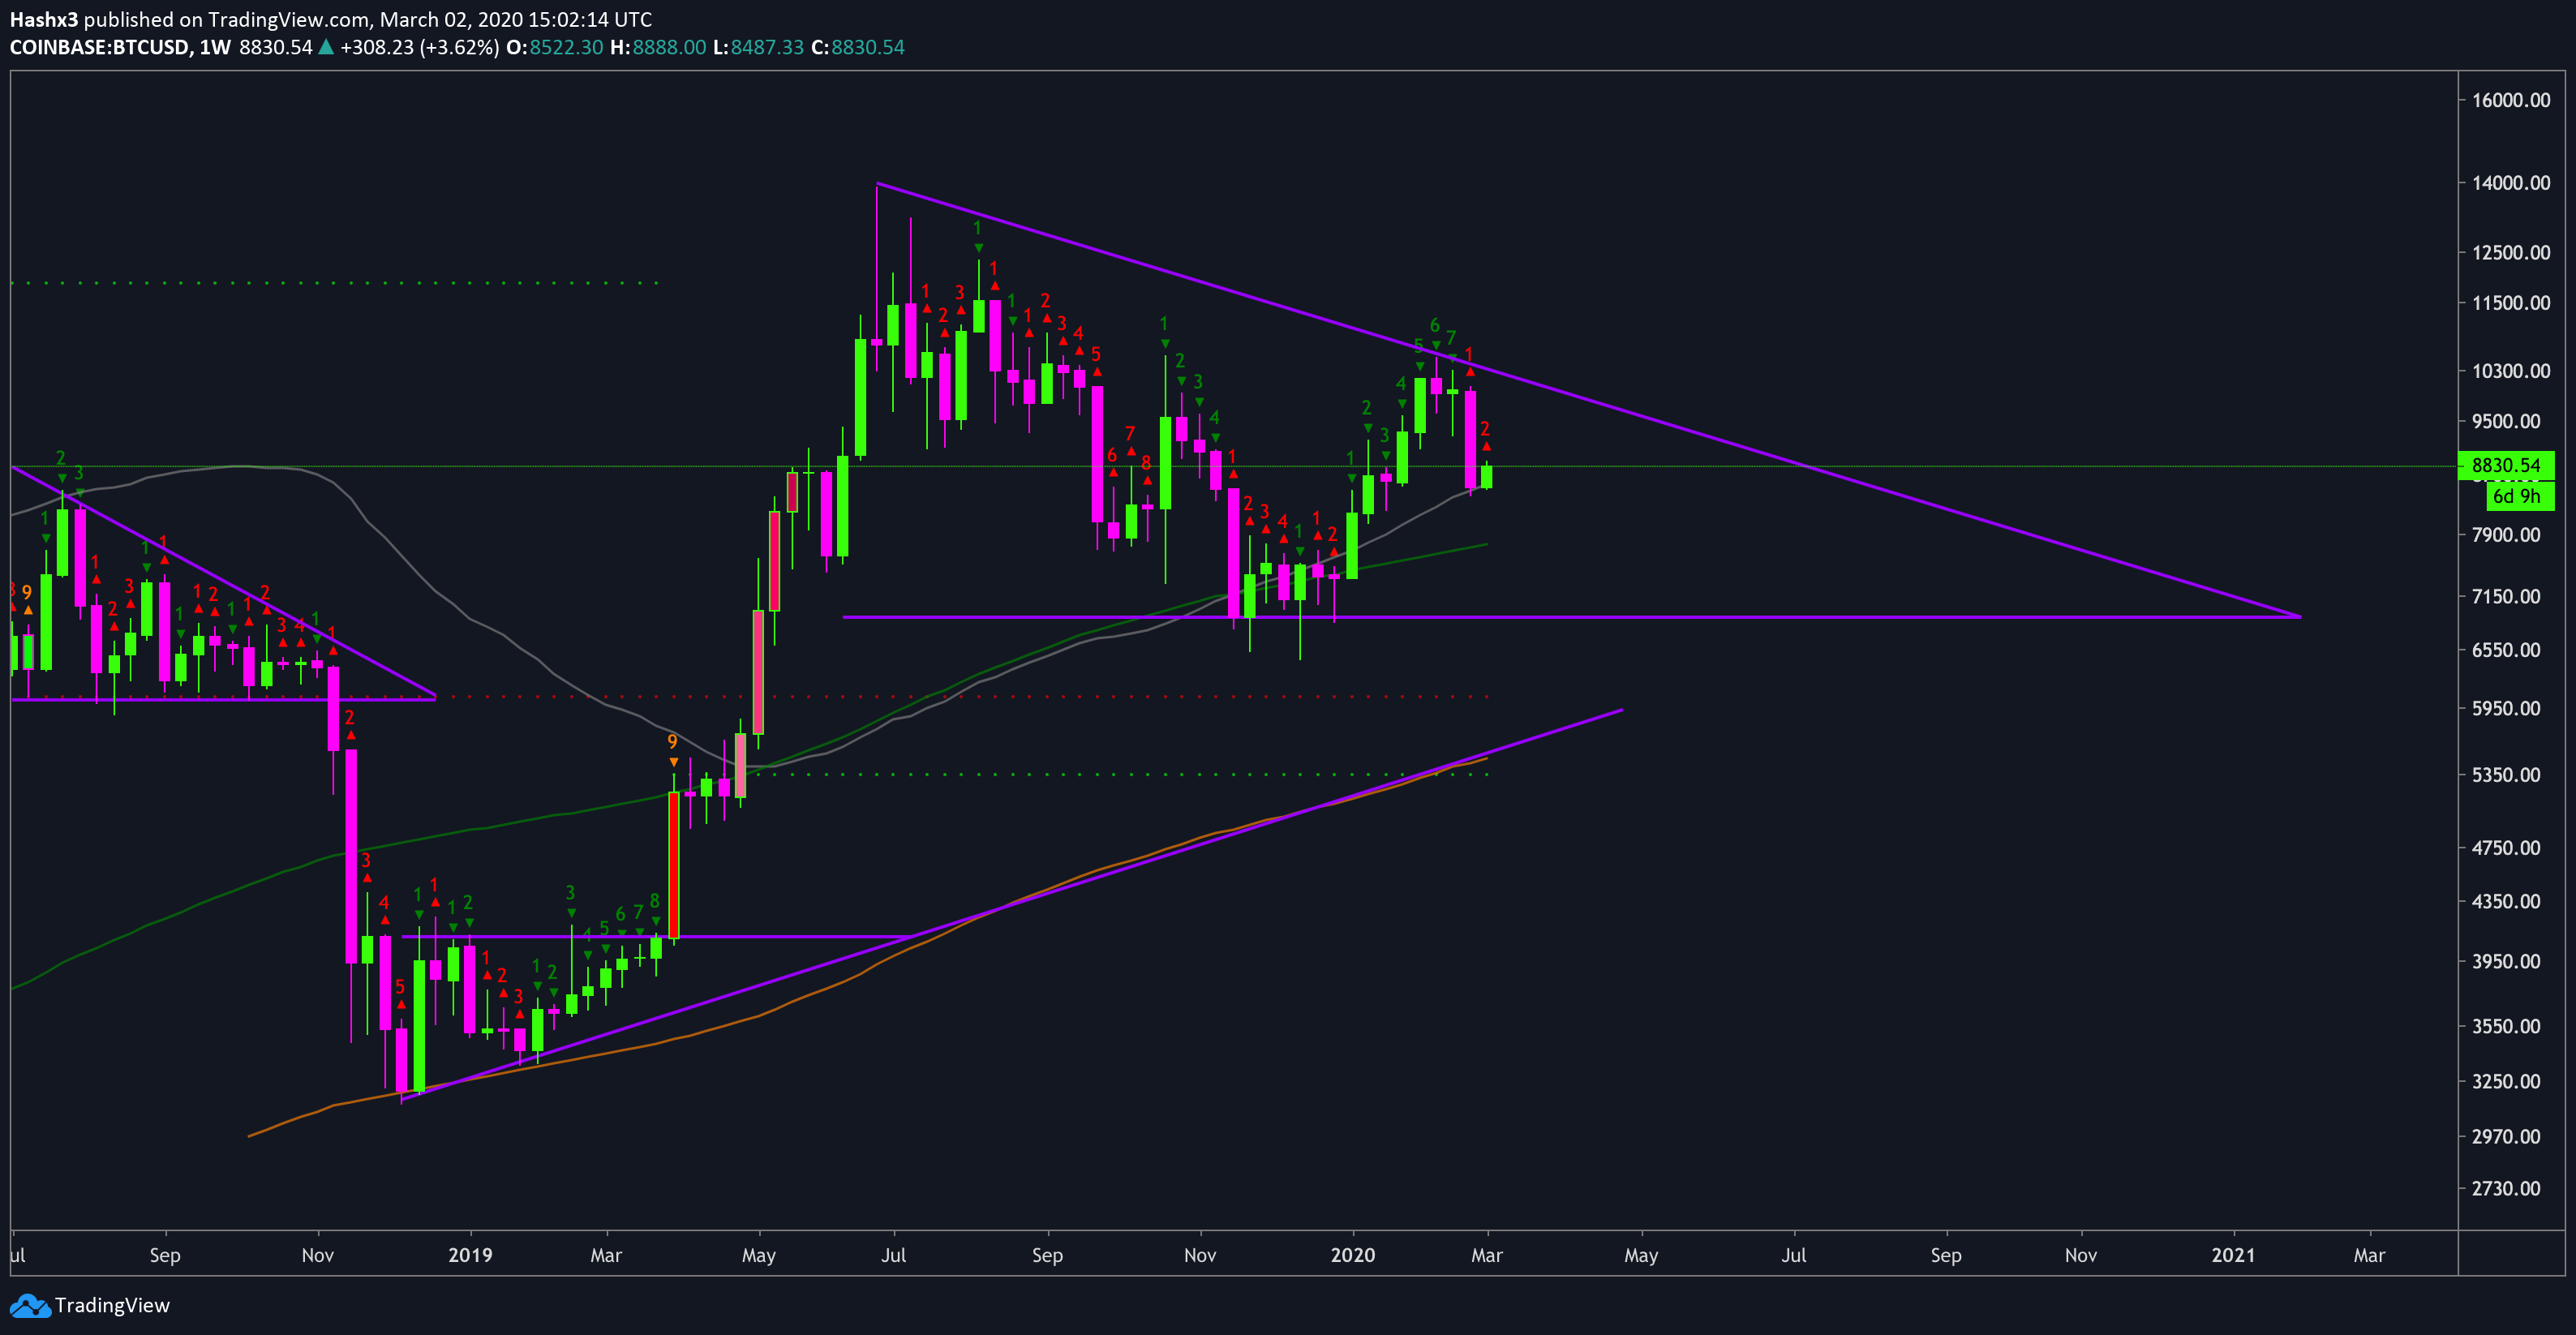
After creating a new lower high on the macro trend, Bitcoin is entering a tentative macro descending triangle on the weekly chart. While at current time it is uncertain whether this reversal formation will play out, the bulls must continue to create higher lows to avoid falling into this detrimental pattern. Personally, we believe the increase in Bitcoin’s stock to flow ratio will propel price higher after May 2020. However, we still can’t ignore the warning of this pattern. Although it is not a concern as of now, we will continue to monitor whether Bitcoin will be able to create new higher highs.
Conclusion
Last week’s decline ended up being a good opportunity to buy the dip. As of now, the bulls are fighting back and standing strong at $8.8k. Critical resistance remains at $9.5k while current support stands at $8.5k.