
Cryptocurrency
Bitcoin Bull Trap: Sub $5k Incoming?
Bitcoin has been stuck at the $5k support level for the past two days while upward momentum has begun to slow. On the daily chart above, the sequential indicator is currently on a red 3 candle, furthermore if downward momentum drops below $4.9k the trend may soon pull back to the 200MA (purple) around roughly […]

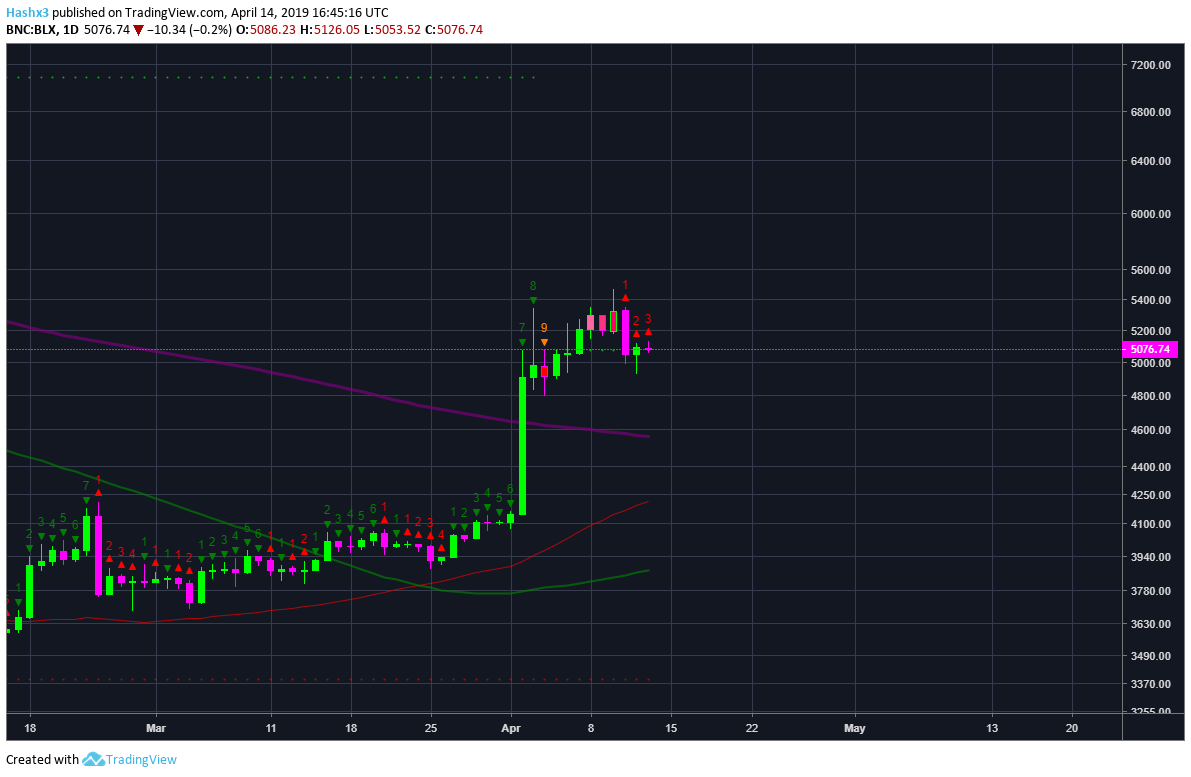
Bitcoin has been stuck at the $5k support level for the past two days while upward momentum has begun to slow. On the daily chart above, the sequential indicator is currently on a red 3 candle, furthermore if downward momentum drops below $4.9k the trend may soon pull back to the 200MA (purple) around roughly $4.5k later in the week.
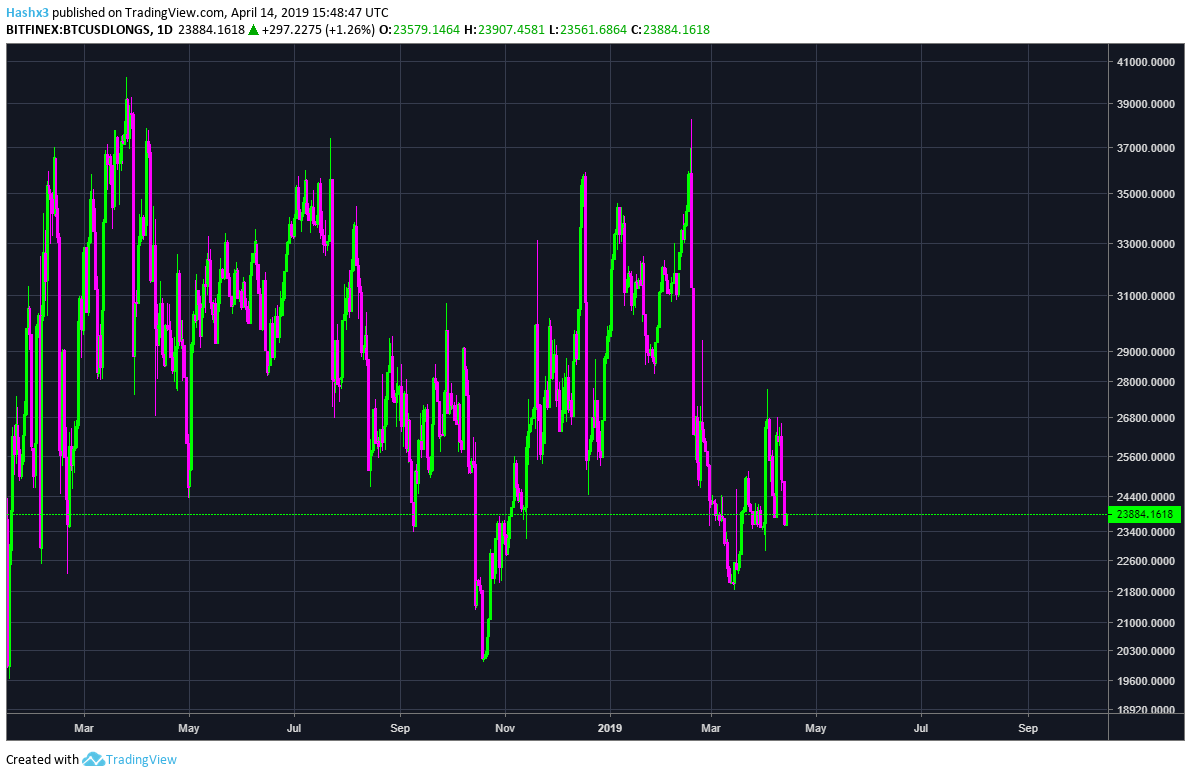
The chart above displays how the longs in the market are deleveraging. This is not a good indicator for a potential short trade. In an ideal short trade, you want to see highly-leveraged longs in the market so they get blown out when price decreases.
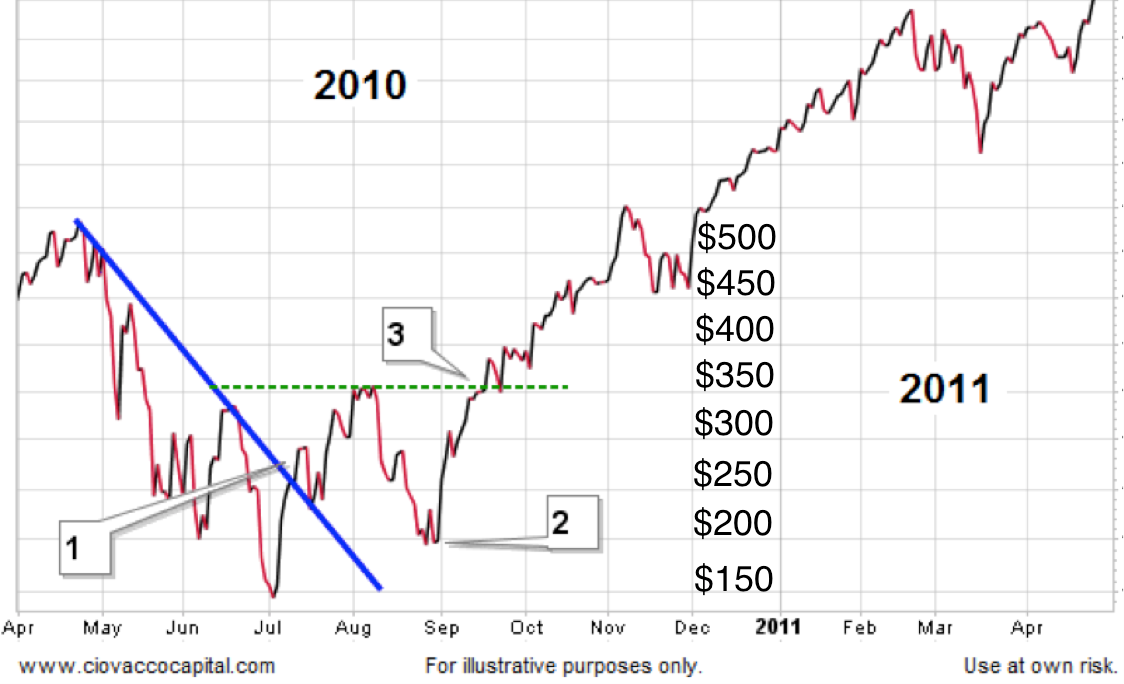
From a macro perspective, if Bitcoin had bottomed, you would ideally want to see something similar to the textbook chart above in which there is a clear higher low 33% above the previous low (1st low: $150/2nd low: $200). Image source: Cointelegraph Article by Tone Vays.
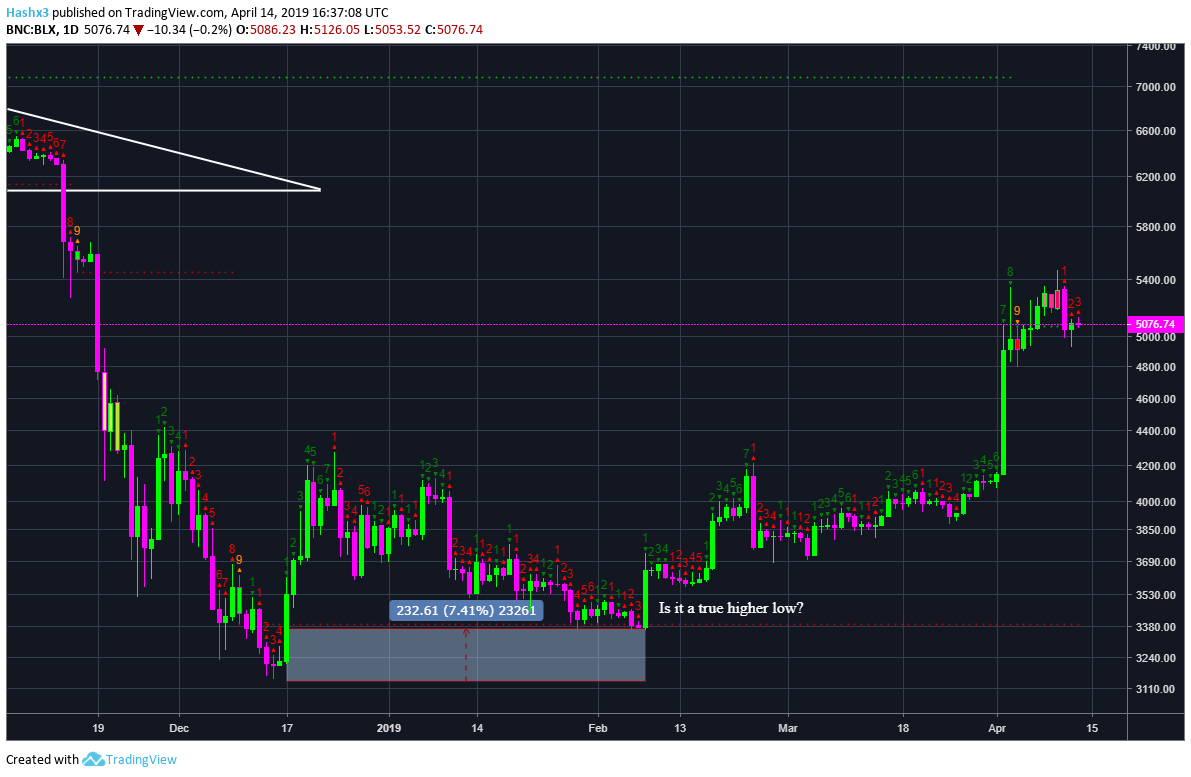
However, Bitcoin’s higher low (shown below) only had a difference of 7%, so was it a true higher low? This point has been debated among traders in the space and many bears think Bitcoin will have to retouch the previous low a third time before a true higher low can be established.
Daily
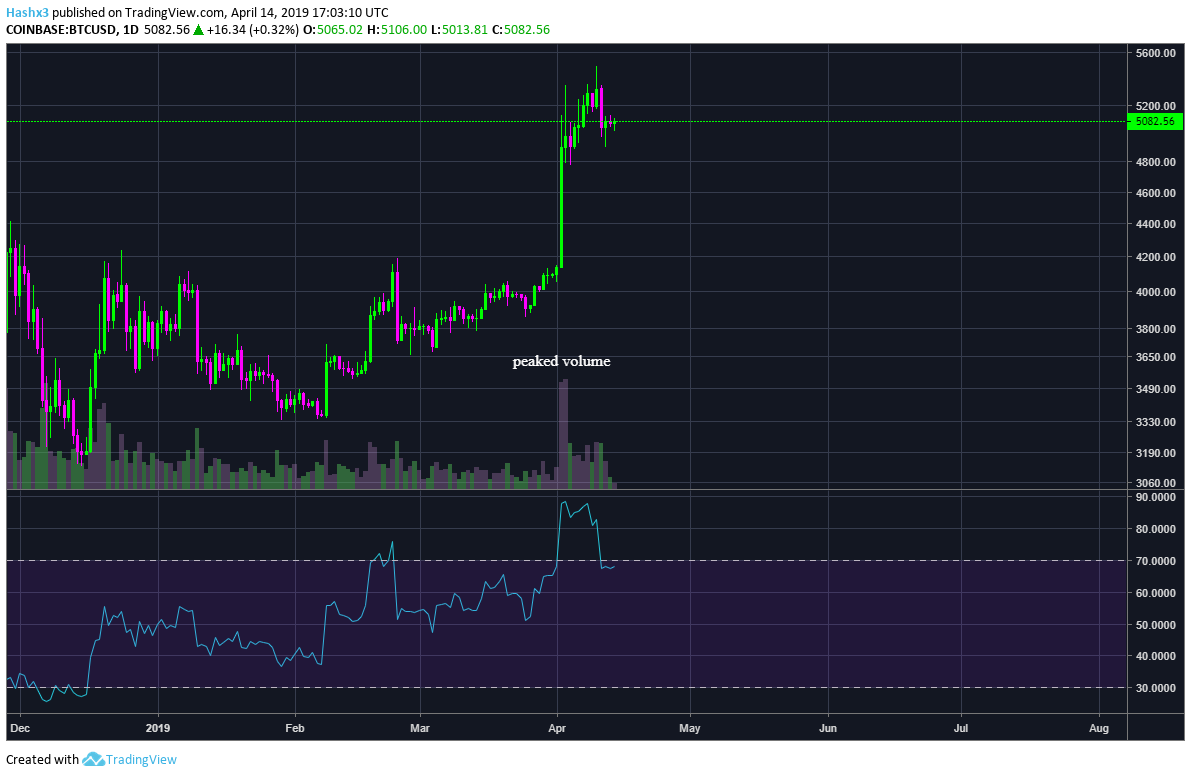
For now, Bitcoin is still attempting to form support at $5k. On the daily chart above, RSI is at 68 which is somewhat neutral but closer to overbought territory. Additionally, volume recently climaxed when we reached a high of $5.4k. Ever since, upward momentum has fallen. When volume is at a climax, it is generally indicative of a market top. Once volume tends to dissipate, the trend begins to tentatively pull back.
Another interesting indicator is Tom Lee’s Bitcoin Misery Index. Recently, Lee tweeted about his misery index hitting its most-optimistic level since June 2016, noting ‘it means good or bad.’ The index rates positive market sentiment at 100 while 0 indicates utter misery.
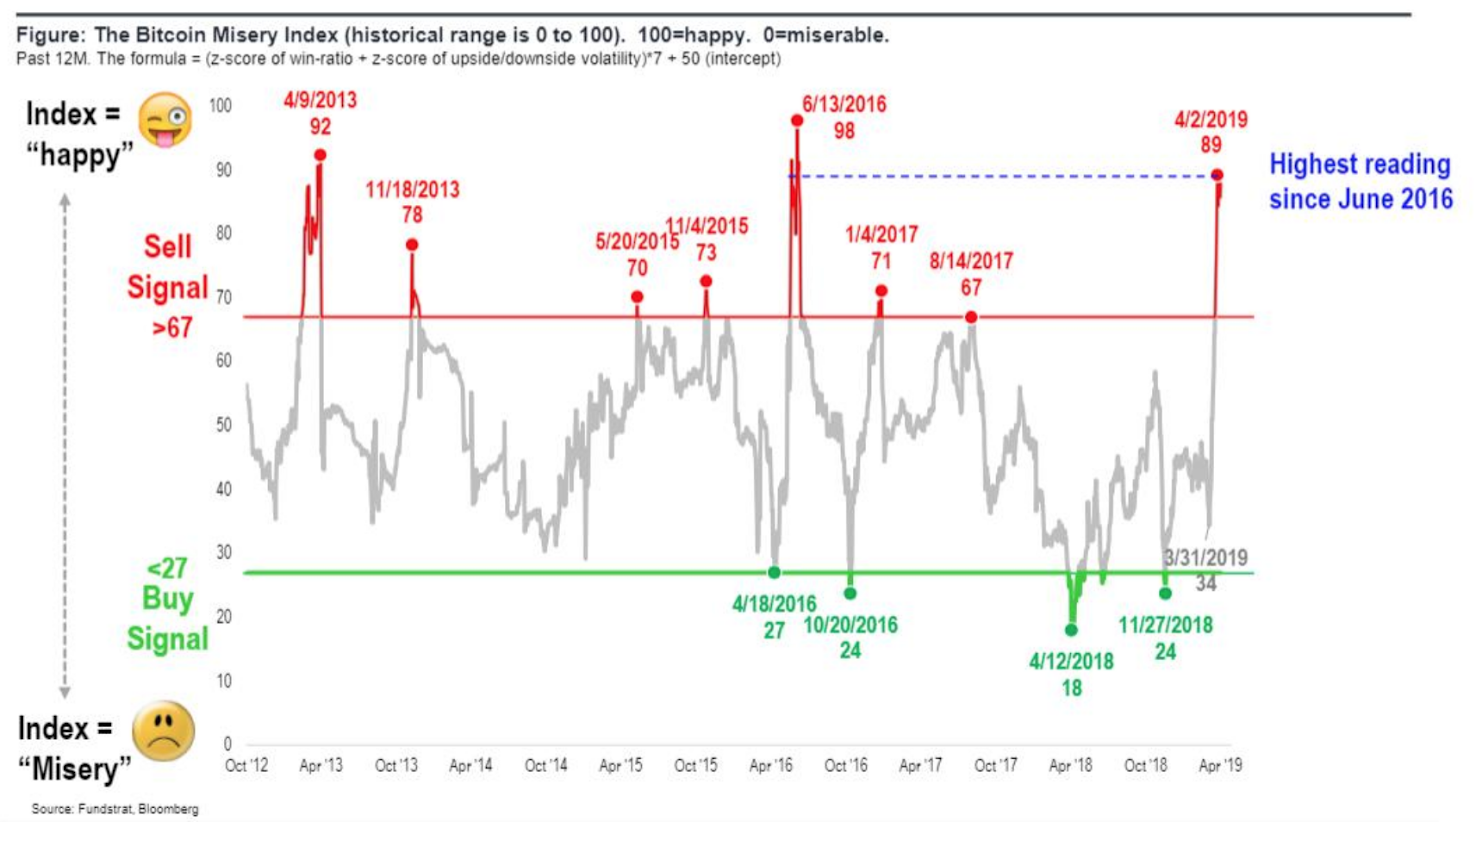
After a series of tweets Lee concluded, “The main takeaway is that the BMI (Bitcoin Misery Index) reaching 67 is further evidence the bear market for bitcoin ended at $3k.”
Whether Bitcoin has bottomed or not, there seems to be compelling reasons for both the bearish and bullish perspectives.
Disclaimer: Nothing in this article should be considered financial advice. Please make objective decisions and do your own research. The author of the article owns Bitcoin.