
Cryptocurrency
Bitcoin Capitulation to $1.8k Inevitable?
Although the total cryptocurrency market cap has had a slight increase in volume from January to February, the increase isn’t significant enough to be a bullish indicator. Some bulls have argued this is the beginning of a rounding bottom, however, Bitcoin’s volume has been relatively consistent which may suggest the existing money in the space […]
Although the total cryptocurrency market cap has had a slight increase in volume from January to February, the increase isn’t significant enough to be a bullish indicator. Some bulls have argued this is the beginning of a rounding bottom, however, Bitcoin’s volume has been relatively consistent which may suggest the existing money in the space is merely being recycled in-and-out of the market. Additionally, it is possible that volume could be lower than our current projections due to exchanges faking volume, which has occurred multiple times in the past.
In the depths of the bear market, it is possible that we will continue to remain bearish and squeeze out weak hands until the total market cap decreases severely. The Bitcoin monthly chart (below) is forming a potential bear flag pattern with a target of roughly $1.8k. This target would be at the level close to where the previous bull market began, further indicating a complete market cycle and return to mean. If Bitcoin drops anywhere from $1.3k – $1.8k, it is difficult to imagine how much lower price could go. If these levels are reached, the risk-to-reward ratio is going to have incredible upside, (at least in the eyes of some). Nevertheless, this does not imply price movement won’t turn bullish in the short term.
As the month of February closes, it is interesting to note that prior to the drop at $6k (Nov 2018), there were three consecutive months with low/declining volume. This led to low volatility and little price action. In fact, there was a two month period prior to the drop at $6k where Bitcoin was less volatile than the S&P 500.
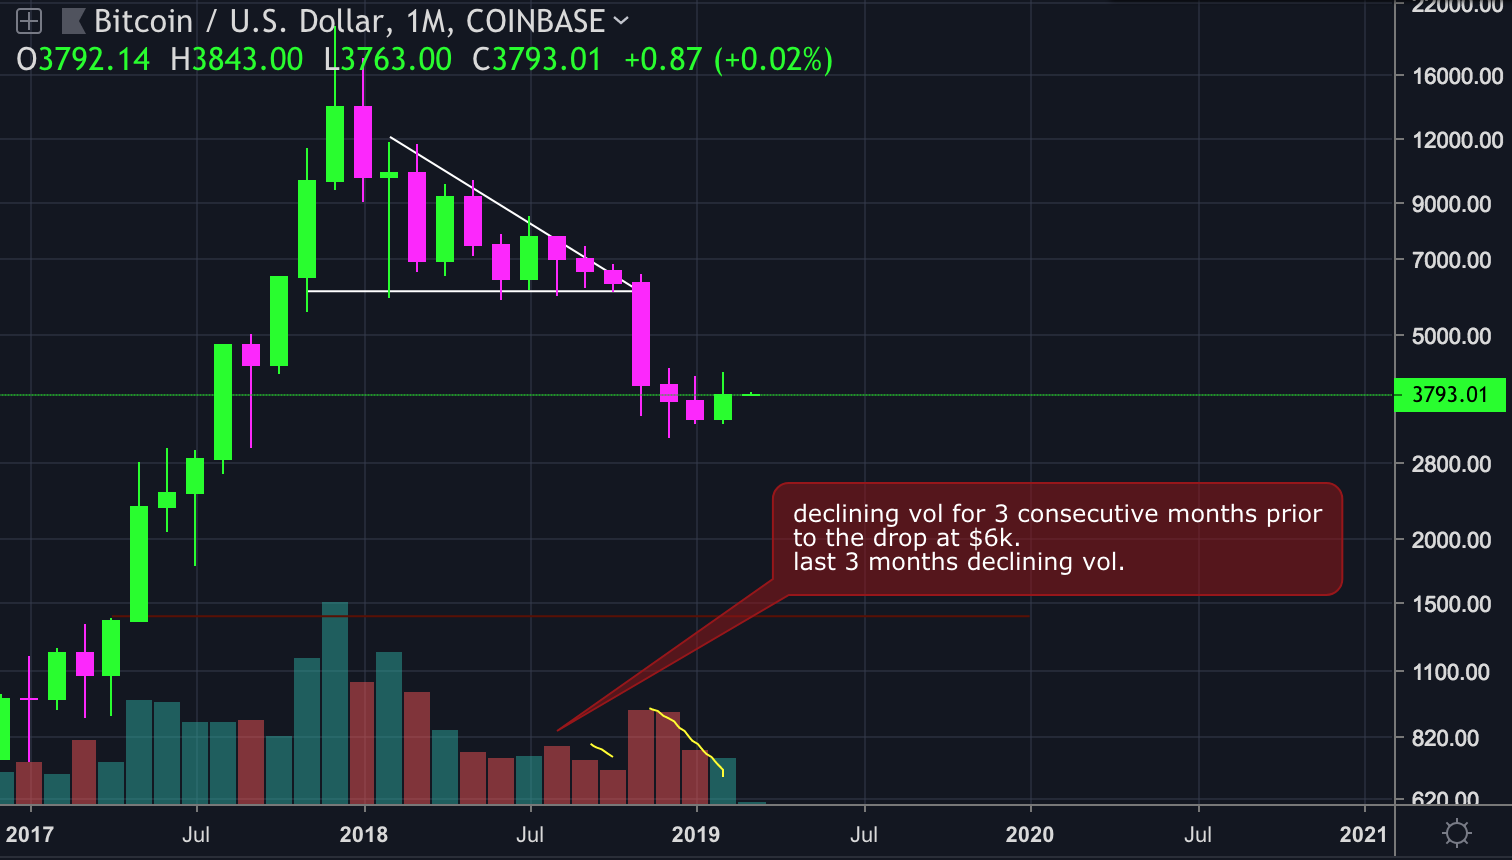
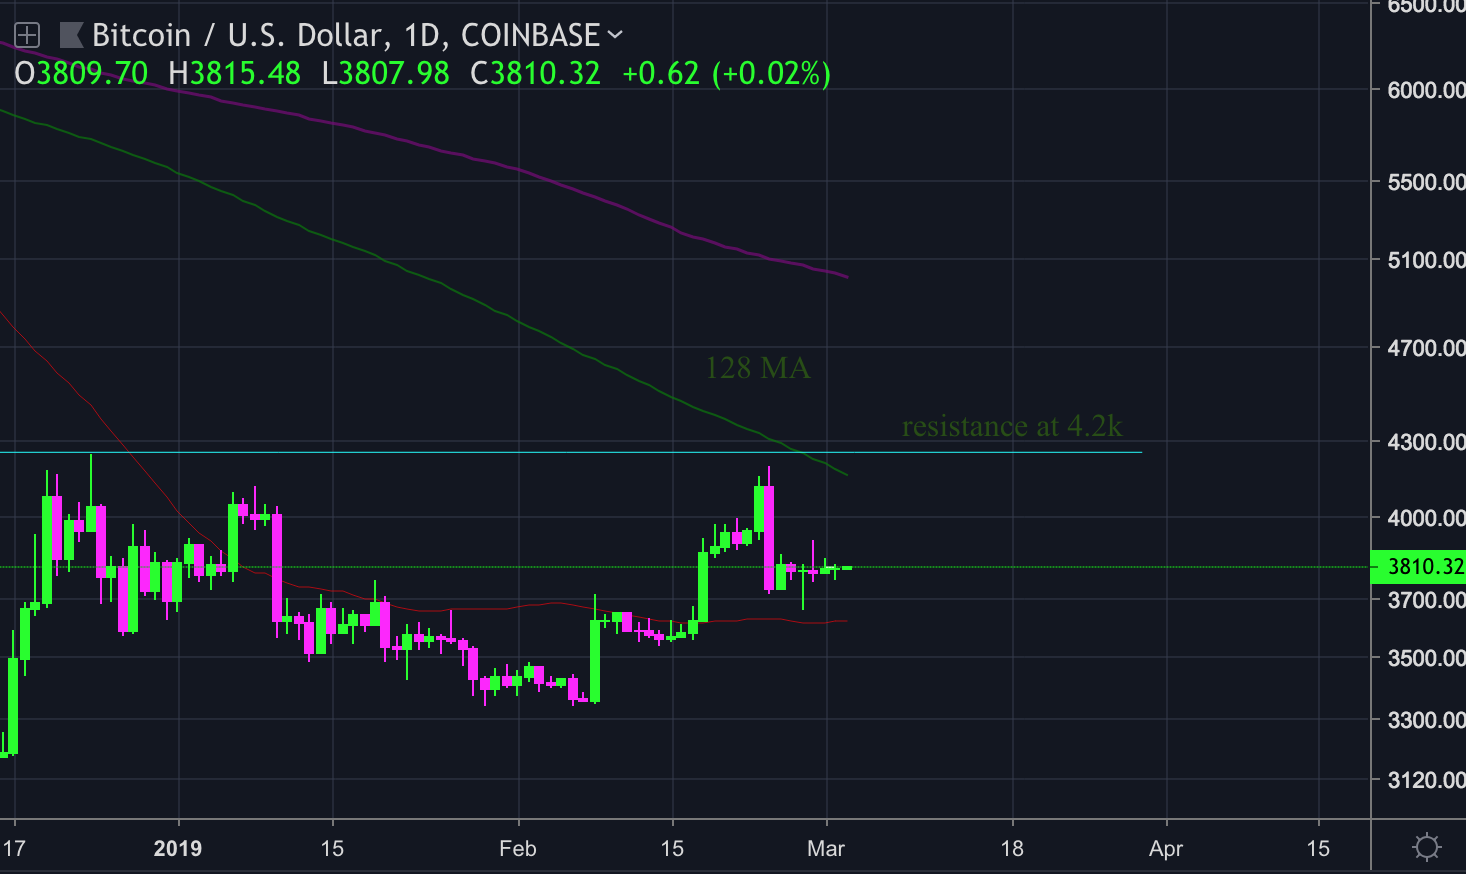
The previous three months have had low/declining volume which has, in part, led to stable price action throughout the past week. If Bitcoin continues to remain in a tight range for another week, price action will likely be explosive in one direction or another. Judging by the lack of new capital and strong resistance at $4.2k, it’s going to be hard for the bulls to make a significant move upward.
Additionally, the 128 MA (shown below) has been acting as a resistance level at $4.2k. The 128 MA has been a critical indicator for the life cycle of Bitcoin throughout the years. If $4.2k is broken to the upside, there is a good possibility we could rocket ship upward straight to $5k. Its going to be very difficult, but this is one bullish scenario.
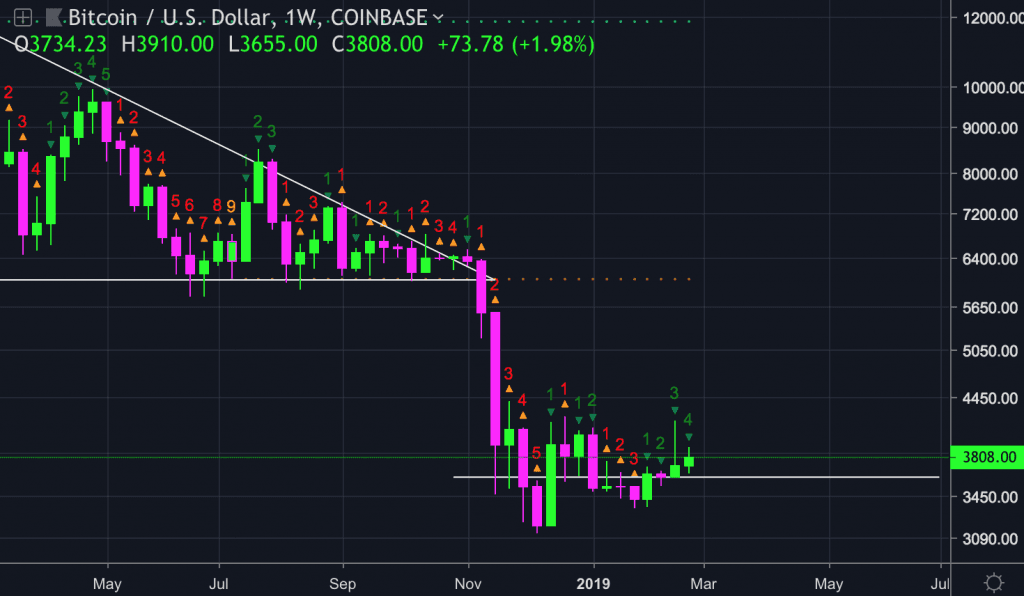
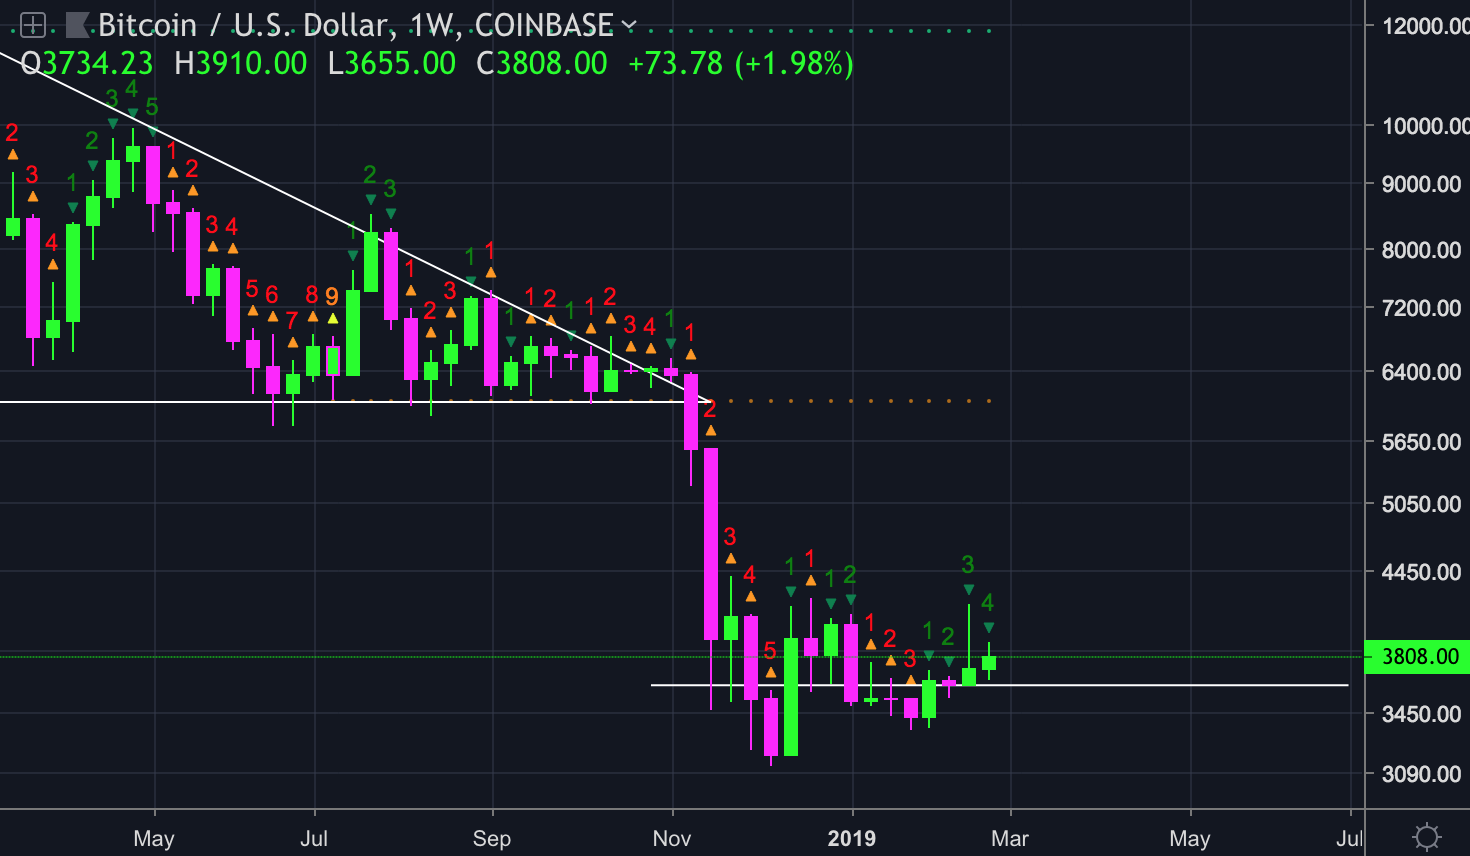
When viewing the TD sequential indicator, the daily chart is still relatively neutral. The sequential weekly chart below remains bullish, but this information doesn’t provide enough conviction to place a trade in either direction. For now, it seems appropriate to wait for further confirmation. One key principle to remember from this article: a pattern or formation means nothing until it is confirmed.
Disclaimer: I am not a financial advisor. This is not financial advice. Please do your research independently and make objective decisions. This article is intended to educate readers on the recent state of the cryptocurrency market. The author of the article owns cryptocurrency.
Charts are from tradingview.com