
Cryptocurrency
Bitcoin Dips to New Lows a Month Before Halving – Time to Buy?
Daily On the daily chart above, Bitcoin is on a red 4 of 9 candle. Therefore, the sequential indicator is telling you that there will likely be 5 more days of neutral to bearish price action. Furthermore, it is significant that Bitcoin has fallen below the 200MA (orange) which will now act as resistance for […]
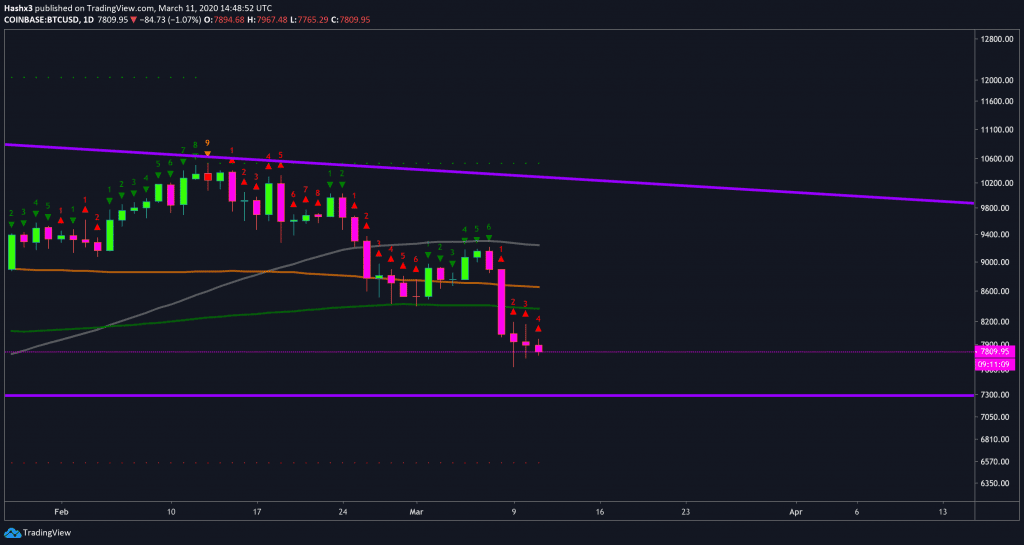
Daily
On the daily chart above, Bitcoin is on a red 4 of 9 candle. Therefore, the sequential indicator is telling you that there will likely be 5 more days of neutral to bearish price action. Furthermore, it is significant that Bitcoin has fallen below the 200MA (orange) which will now act as resistance for the bulls.
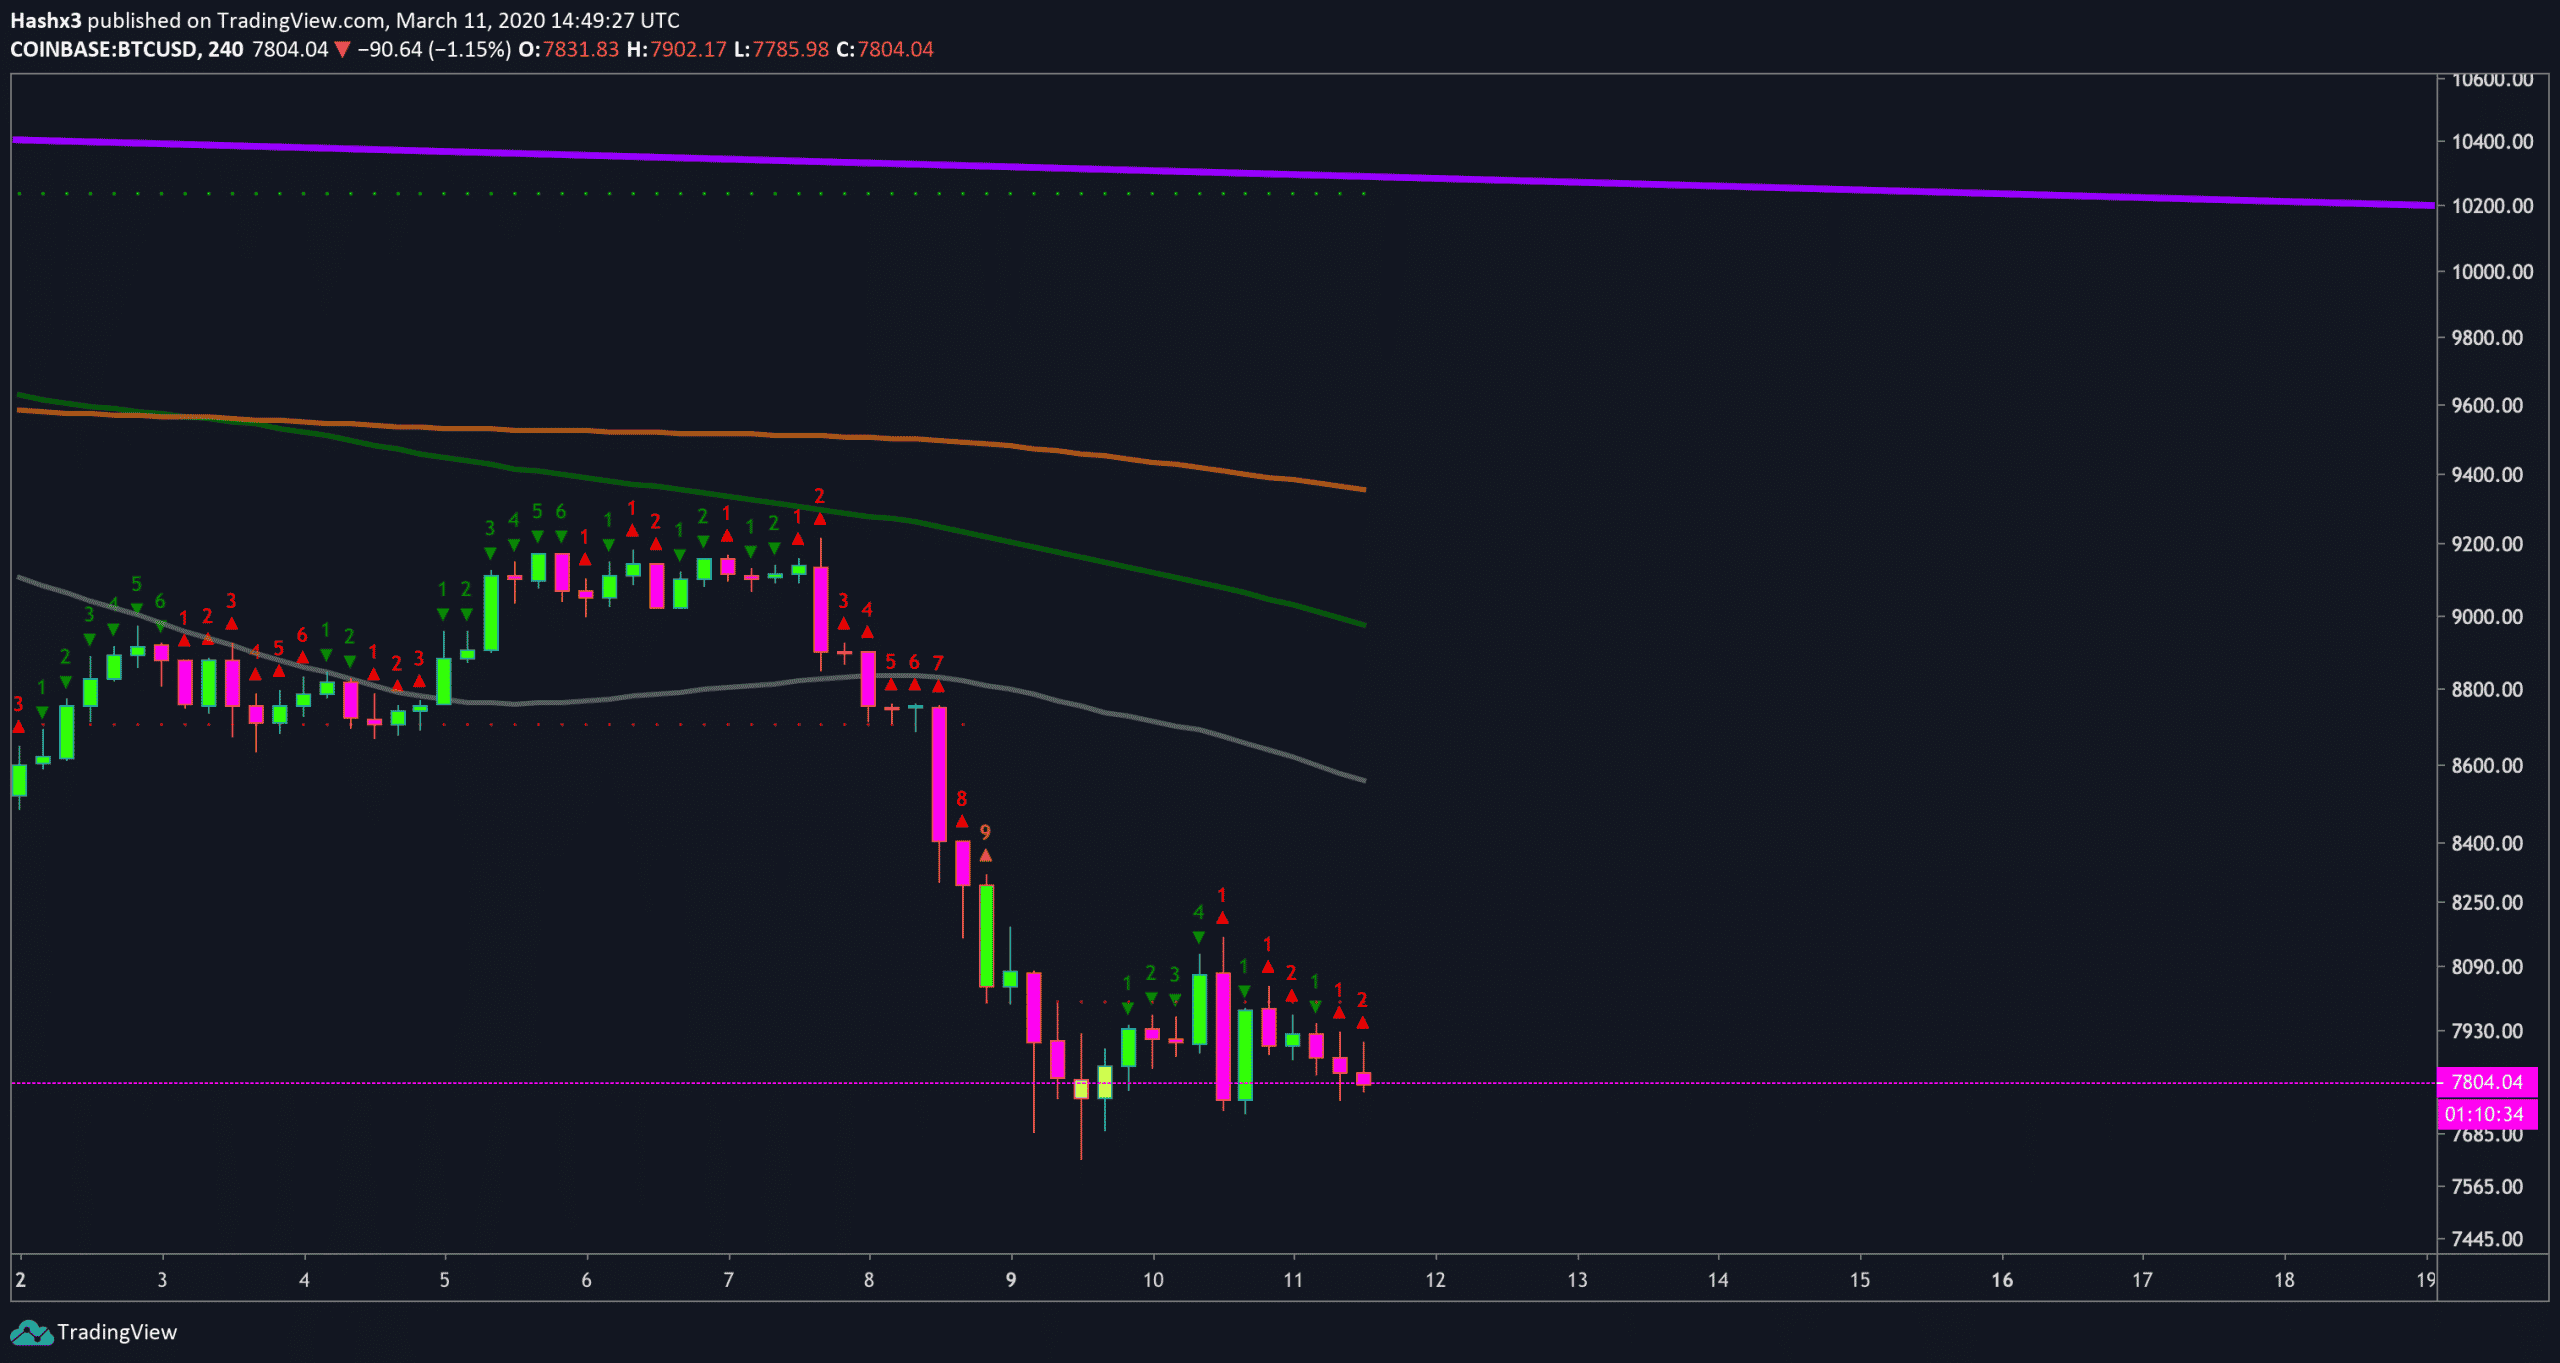
4 Hour
On the 4 hour chart above, Bitcoin has reached a red 2 on the sequential indicator. The sequential indicator triggers a short position when a red 2 candle closes below the previous red 1 candle. However, the risk – reward potential on a current short trade does not have much upside. We’ll explore this concept further while analyzing various oscillators.
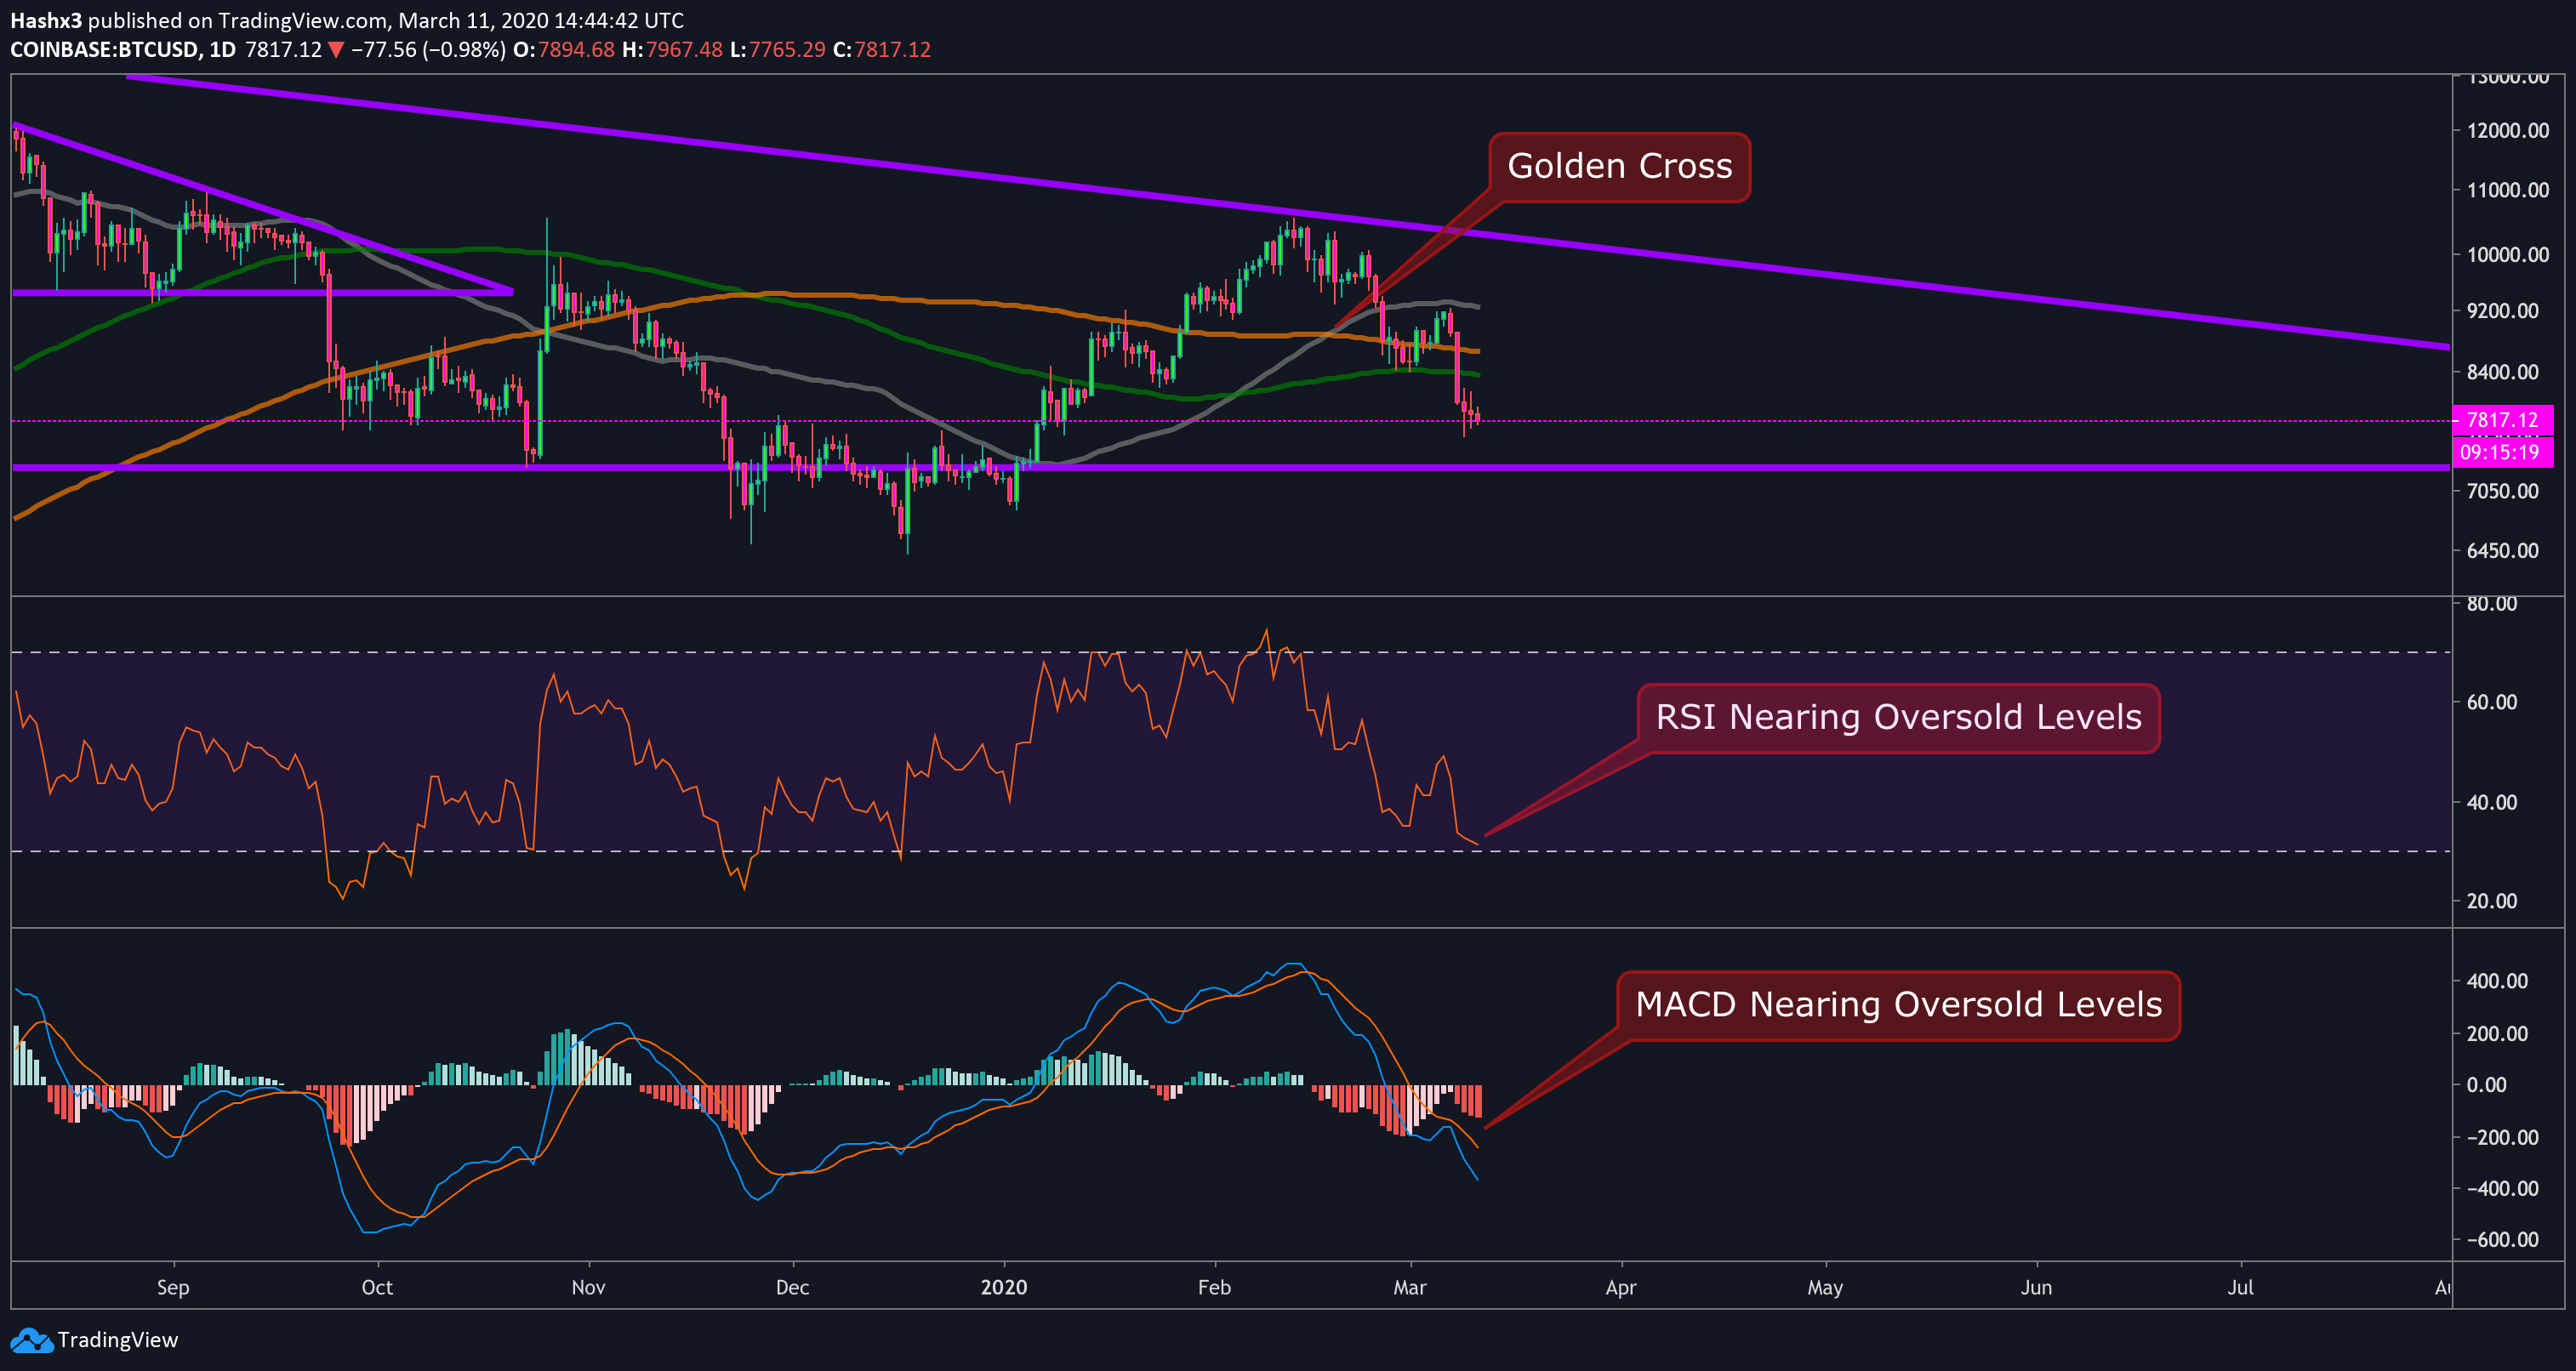
Oscillators
From the chart of oscillators above, you can see that most of them are telling us price has reached vastly oversold levels. That being said, most of these can remain oversold for significant periods of time. On the daily chart above, the moving averages formed a golden cross which some traders consider to be an indication for future bullish price action. However, many fail to realize that moving averages are lagging indicators and are more useful as support and resistance levels. In fact, a golden cross is a reflection of PAST bullish price action, NOT future price action. Therefore, it may be an indication to consider taking profit in future trades.
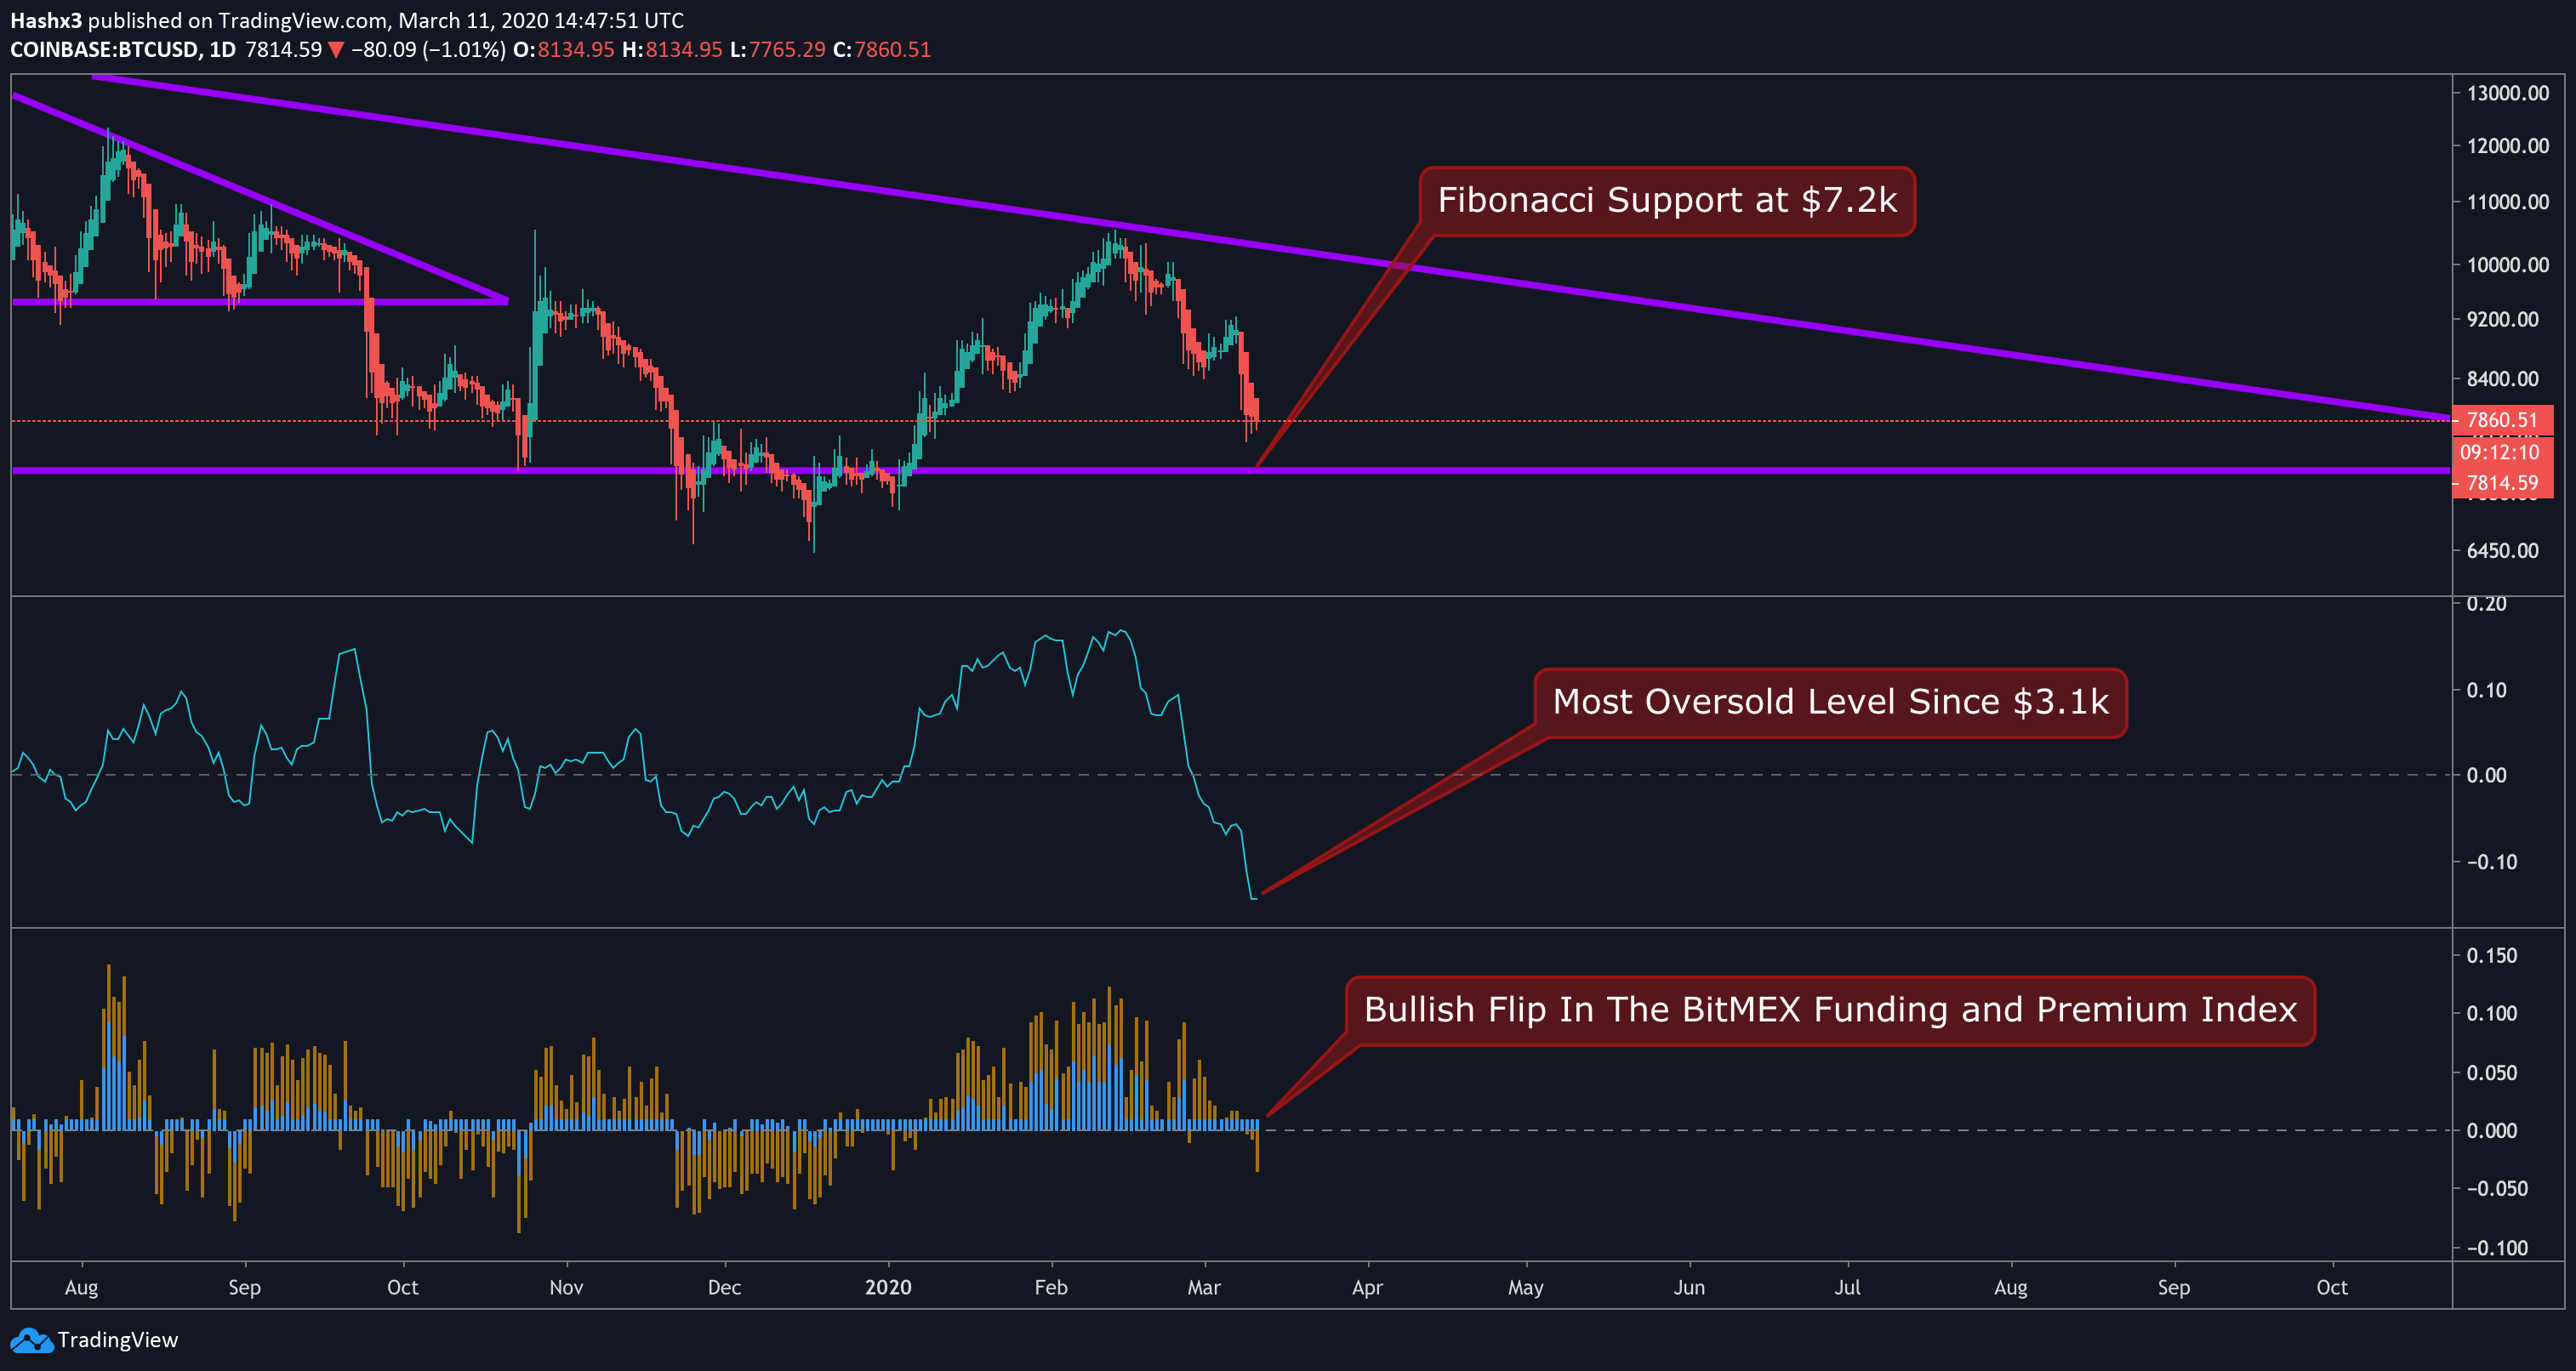
Oscillators Continued…
On the daily chart above, you’ll notice that the CMF has reached an oversold level which we have not experienced since price bottomed at $3.1k. This is possibly the most bullish signal coming from an indicator considering we have not reached this level since the literal bottom of the previous bear market. Also, the BitMEX Funding and Premium Index is a measurement of whether the market is net long or short. Throughout Bitcoin’s previous uptrend, the majority of the market was net long. However, today we have experienced our first bearish flip in the index. Overall, this indicator tells us that the market is now net short and leaning bearish. As contrarians and fundamental Bitcoin bulls, we find that the overwhelming majority is wrong most of the time. While bearish price action can certainly continue as the equity market continues to crash, there is a strong fibonacci support level at approximately $7.2k. Therefore, a short trade has the potential of being profitable, however, the risk – reward profile is not ideal for a large gain (upwards of 20%).

Crypto Fear and Greed Index
At the time of writing, the fear and greed index has reached one of the most fearful levels we’ve ever experienced in the history of crypto.
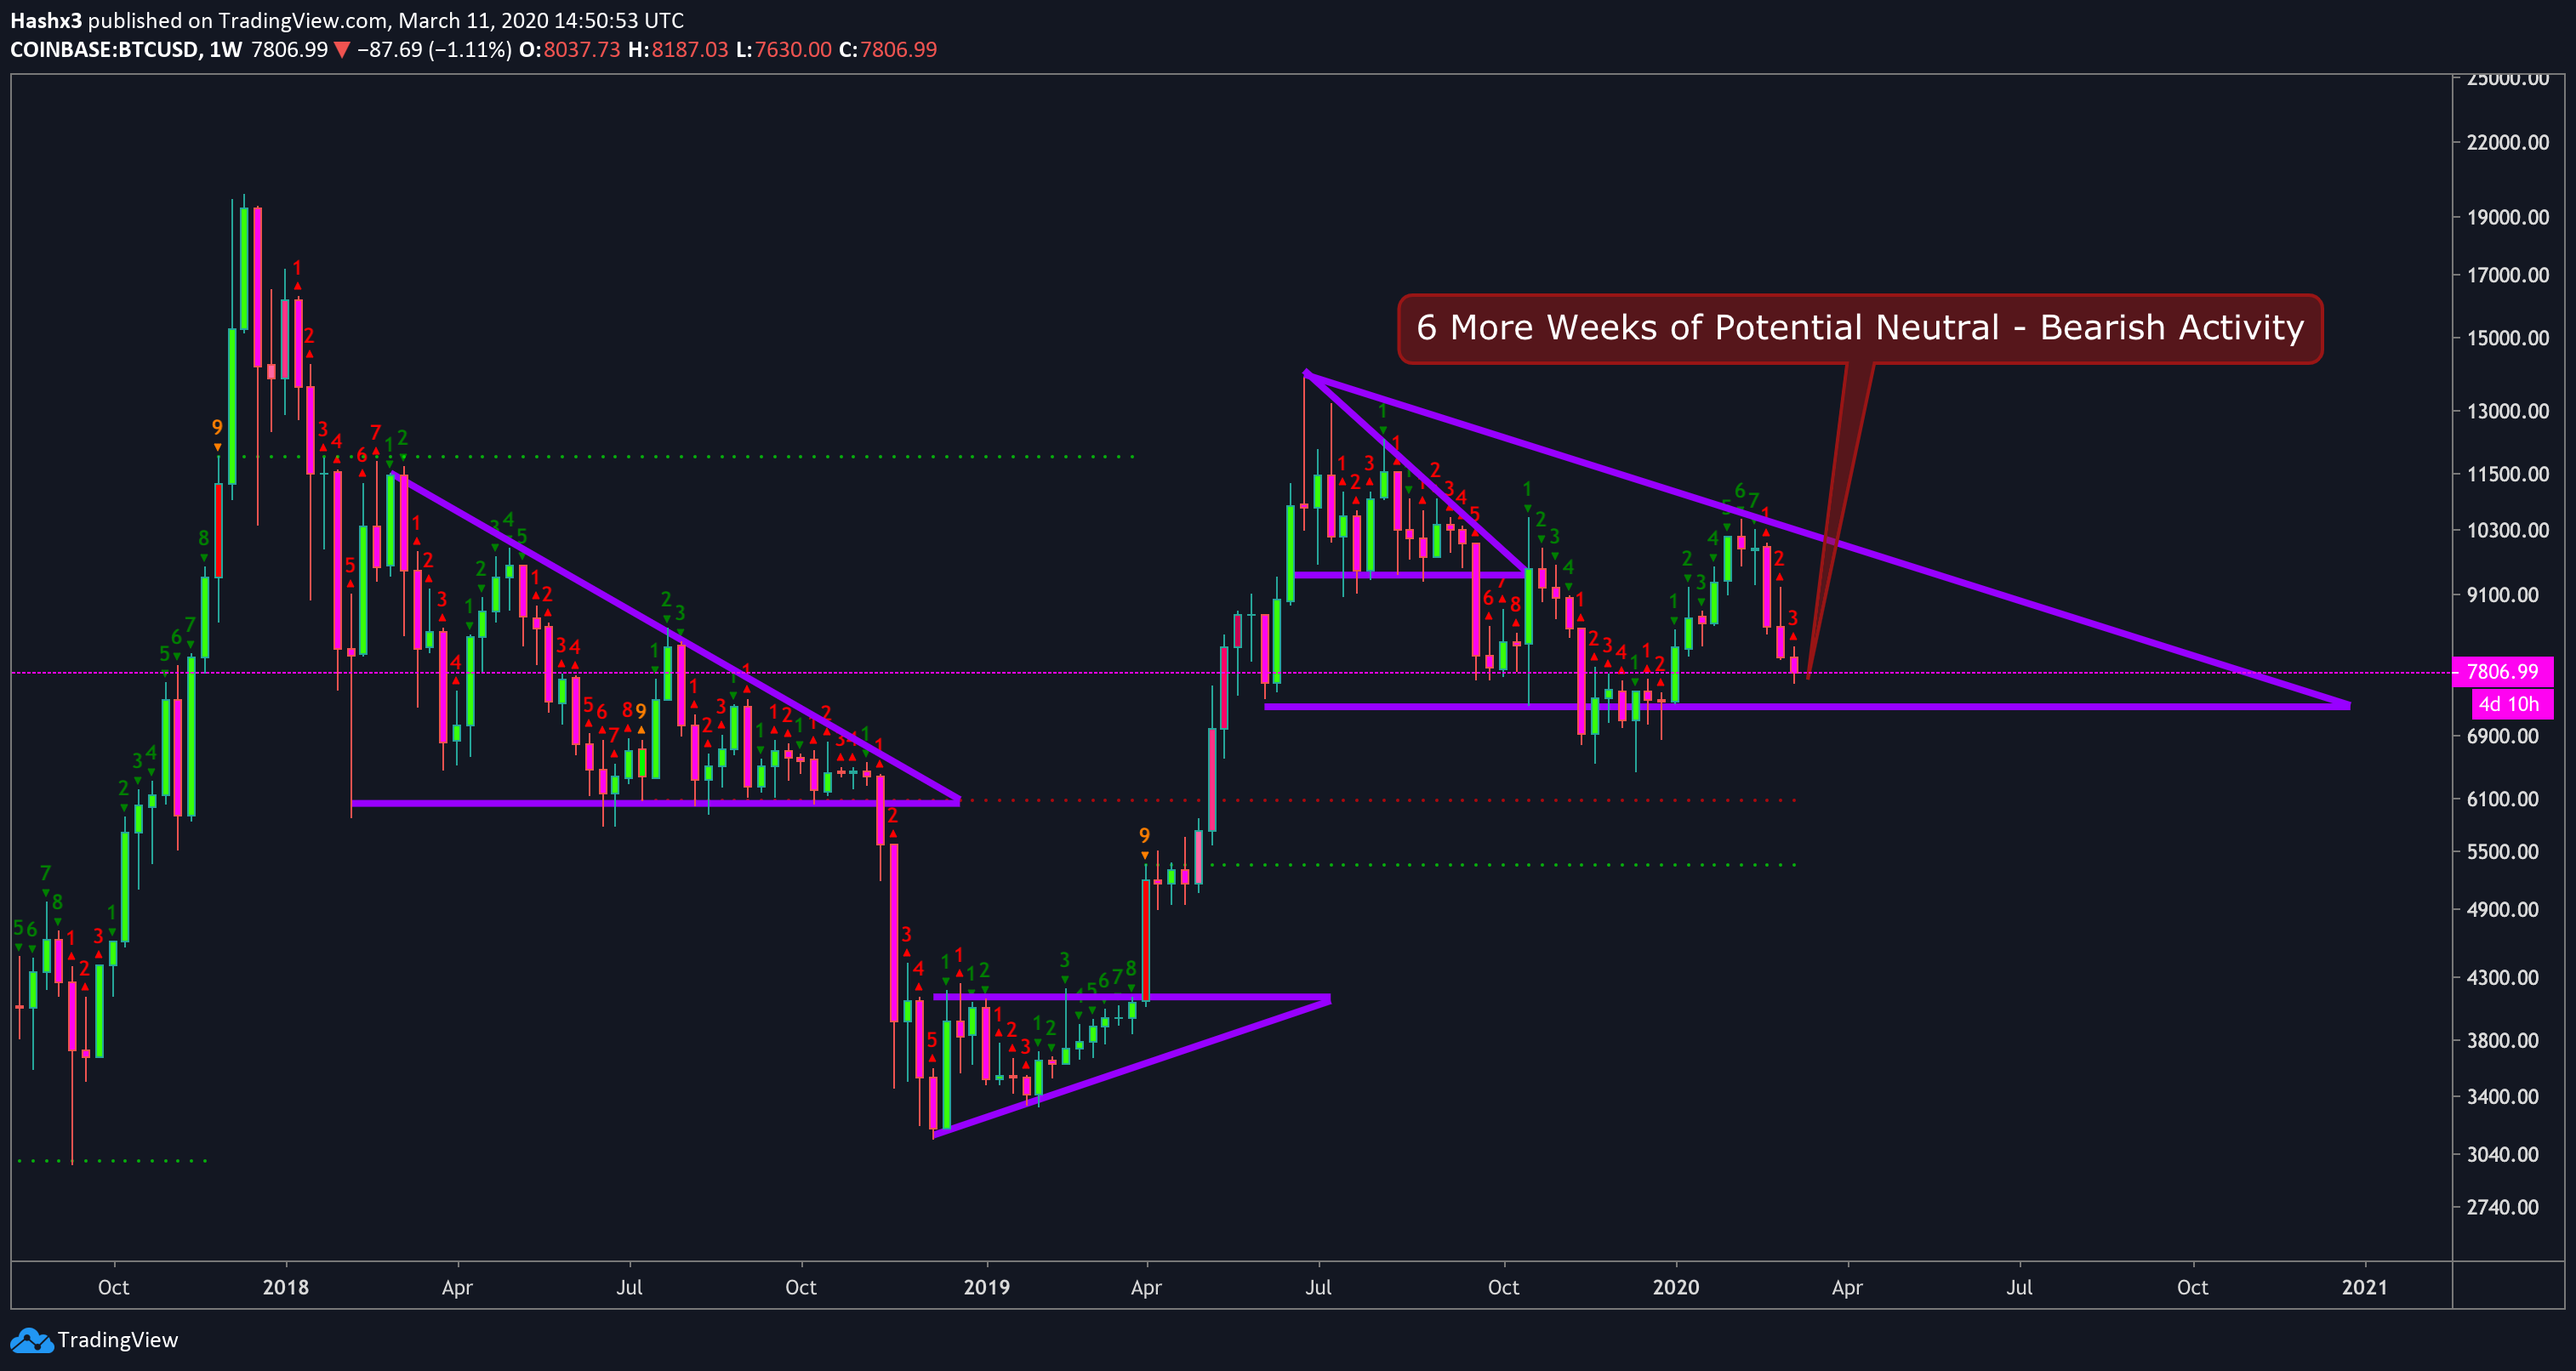
Weekly Macro
As you can see on the chart above, Bitcoin has followed the technicals of ascending and descending triangles very accurately. In classical technical analysis theory, ascending triangles break to the upside 70% of the time, while descending triangles break to the downside 70% of the time. As a fundamental bull, it is concerning to see Bitcoin fall into another descending triangle from a macro viewpoint. However, Bitcoin’s inflation schedule will be cut in half this May which will make the crypto asset even more scarce. Historically, this halving event has been a catalyst for macro bull cycles. While the macro technicals are somewhat bearish, the fundamentals of Bitcoin remain strong and the halving event in May is likely to begin a new rally to $14k.
Conclusion
Since the US Stock Market is crashing, nearly all asset prices around the world are decreasing and Bitcoin is no exception. However, this black swan event may present us with an opportunity to buy Bitcoin for a cheaper price; A price we normally wouldn’t have reached. According to the crypto fear and greed index, the market has never been this fearful. Ultimately, you will have to decide how to play the market with this increasing emotional tension.