
Cryptocurrency
Bitcoin Drops 12% | Larger Pullback Incoming?
Bitcoin Drops 12% Bitcoin drops 12% after dancing around the $8.7k price channel. We have been expecting a pullback after Bitcoin’s parabolic increase throughout the month of May. Looking at Bitcoin’s daily chart above, the sequential indicator is on a red 2. Now that Bitcoin has fallen below critical support at $8.2k, it should be […]
Bitcoin Drops 12%
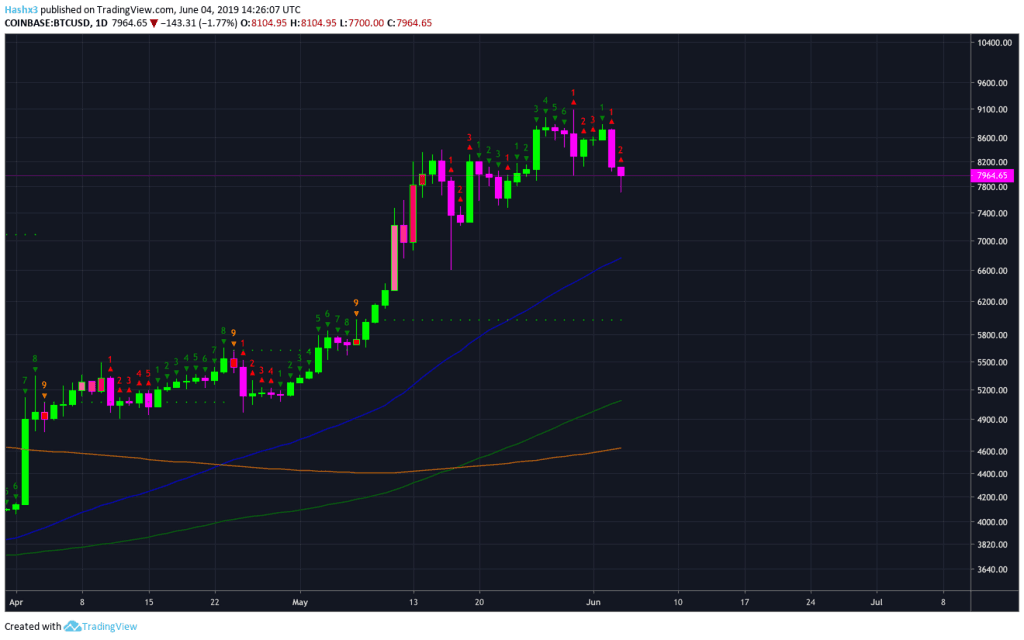
Bitcoin drops 12% after dancing around the $8.7k price channel. We have been expecting a pullback after Bitcoin’s parabolic increase throughout the month of May. Looking at Bitcoin’s daily chart above, the sequential indicator is on a red 2. Now that Bitcoin has fallen below critical support at $8.2k, it should be very difficult for price to climb back above it. Last time price increased past $8.3k it took multiple attempts in the form of an ascending triangle. According to technical analysis theory, previous support should now act as resistance at $8.3k.
Weekly
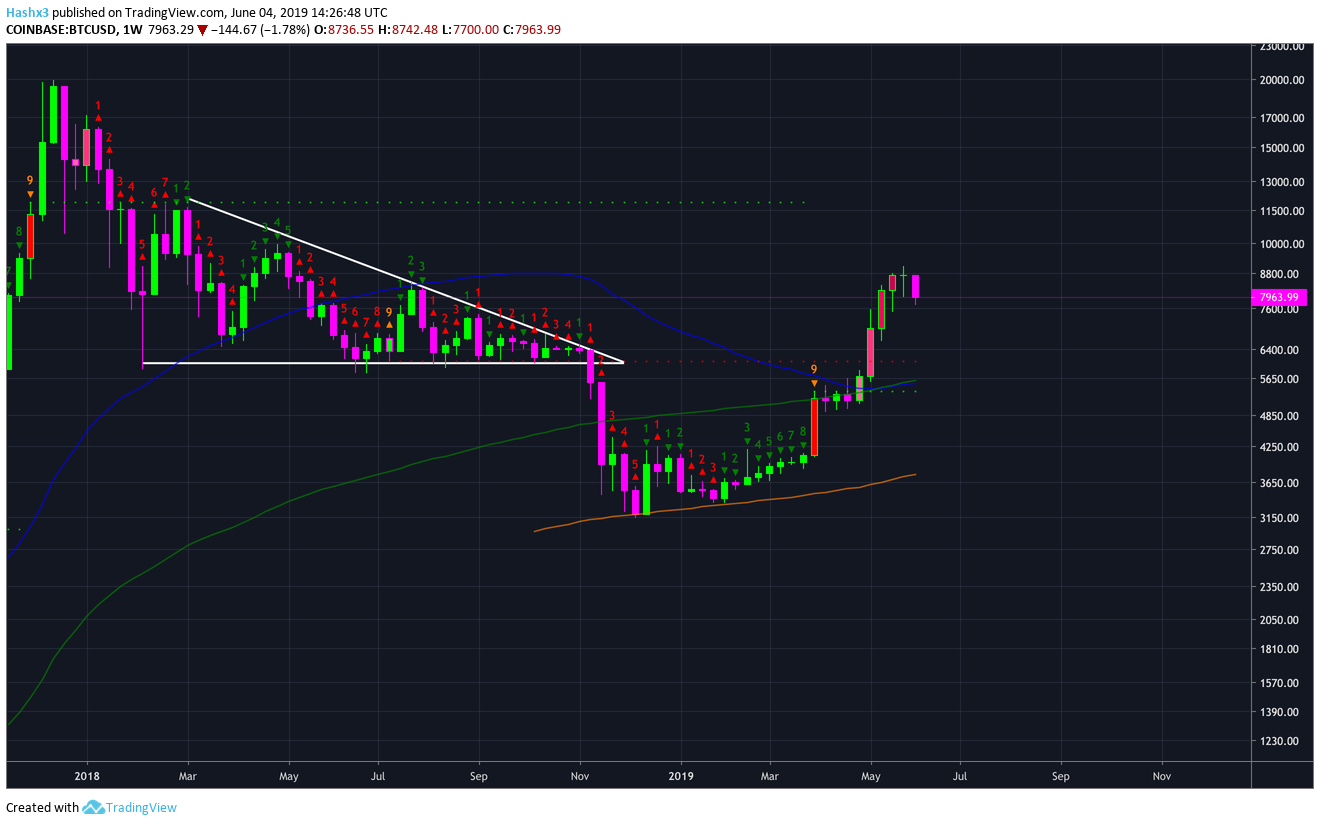
We have been following Bitcoin’s weekly sequential indicator for over a month now and Bitcoin has finally reached a green 9 on the weekly chart. A green 9 is characteristic of a trend reversal and has been a key point of interest for us. Now that Bitcoin has changed direction, traders are asking themselves how substantial this pullback can be.
Historic Pullbacks in Bitcoin Bull Markets
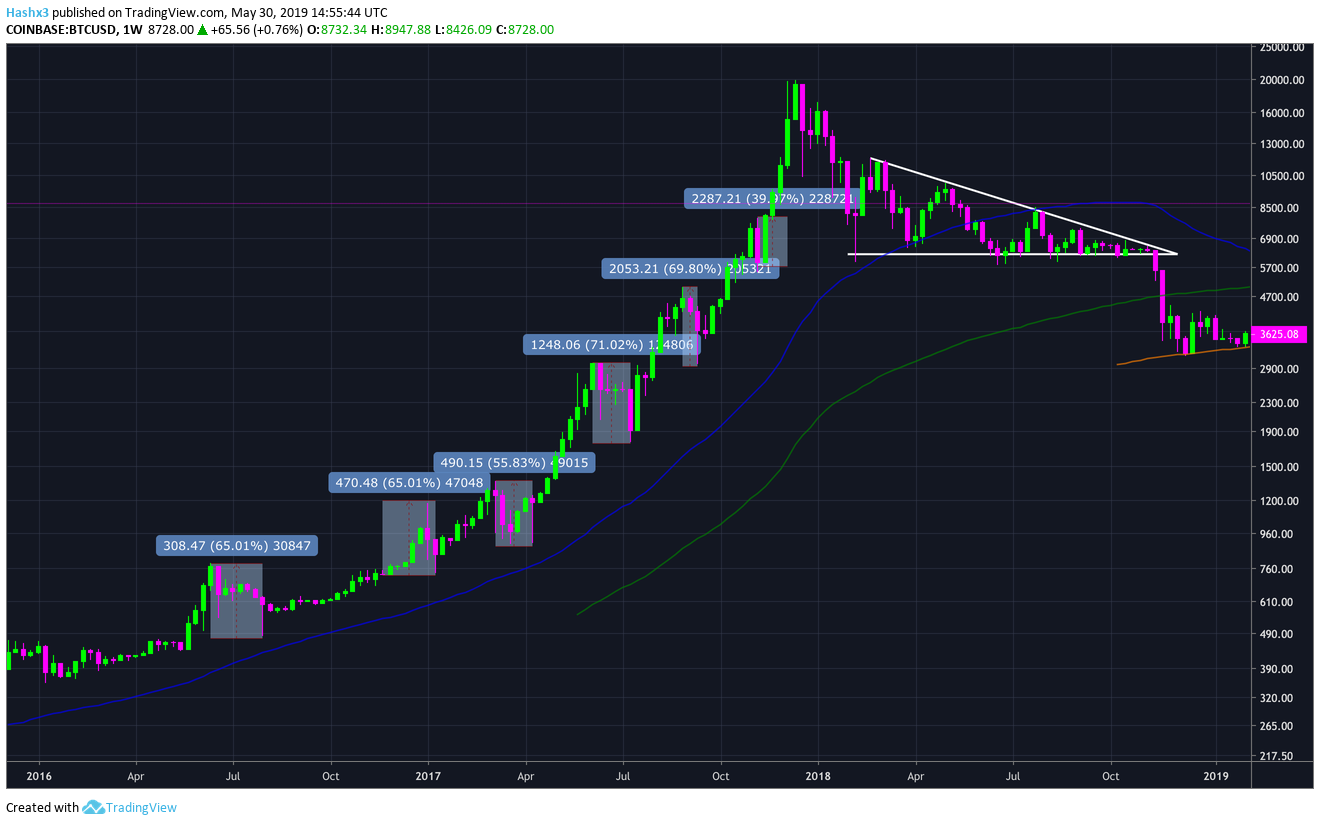
The chart above highlights Bitcoin’s bull run of 2016-2017. Over the course of this market cycle, Bitcoin experienced six pullbacks of +40%. After Bitcoin’s best May performance of all-time, a pullback of this magnitude is to be expected. After reaching a green 9 on the weekly sequential indicator, Bitcoin has pulled back roughly 12-15%. It’s only Tuesday and we’ve already experienced a 15% drop. For an ideal pullback, you want it to take multiple weeks before a potential bottom is reached. This way, price action is truly established as opposed to a brief flash crash.
4 Hour
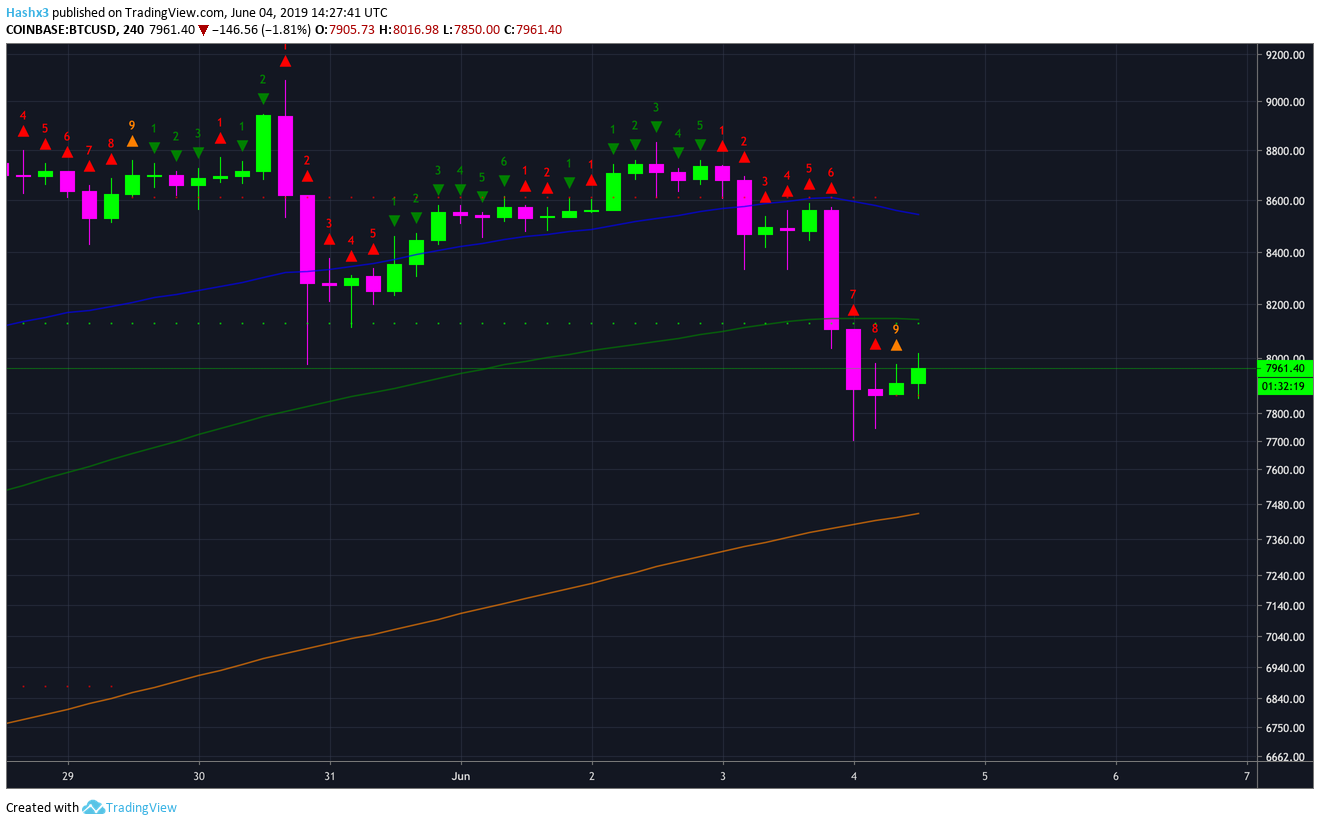
Bitcoin’s 4 hour chart is on a price flip on the sequential indicator. After hitting a red 9, sequential is telling us a small price increase may occur within the next 4-8 hours. From a macro perspective, Bitcoin must break above resistance at $8.2k if the bullish thesis is to remain.
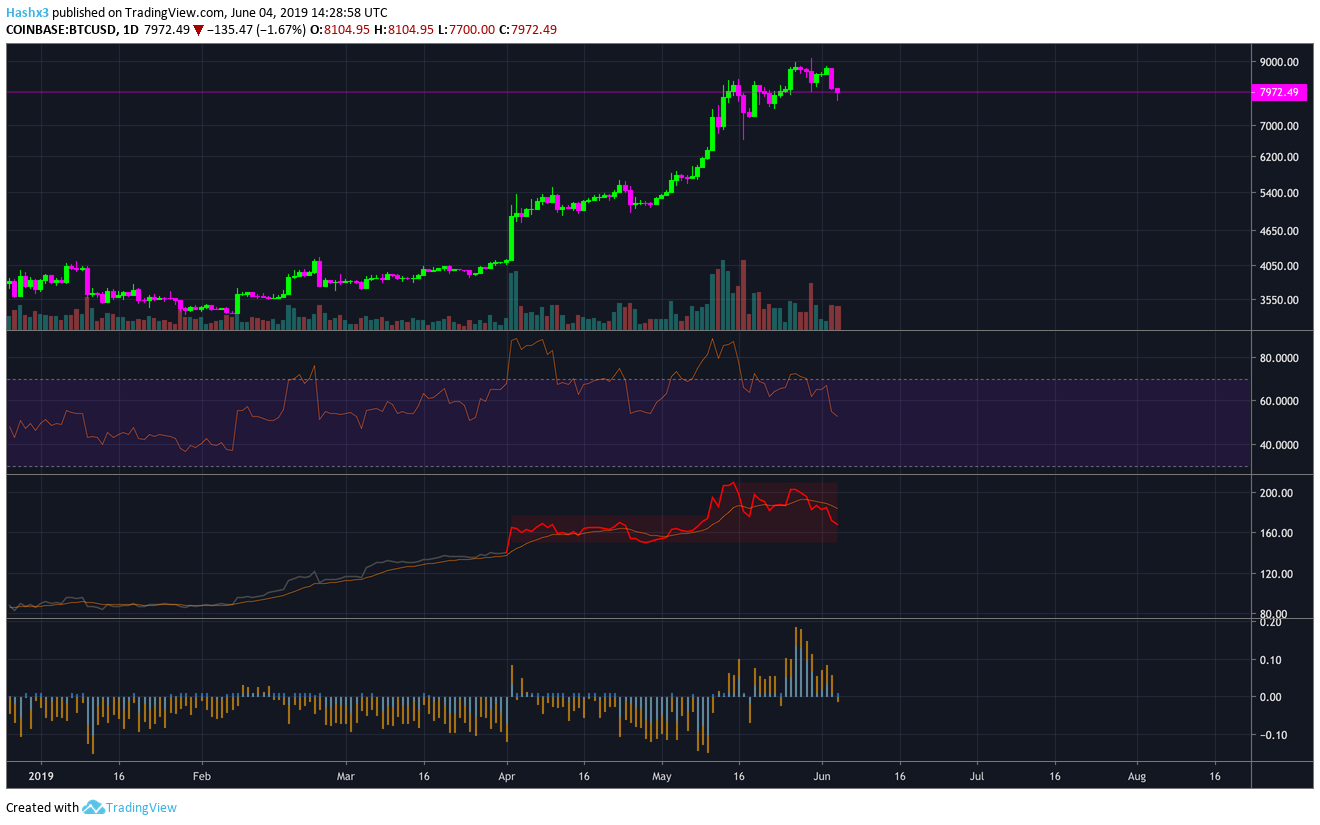
Oscillators
Volume has begun to decrease from the market as price decreases. Bullish momentum is dying and it looks like a substantial pullback is coming. Bitcoin’s daily RSI has now formed a bearish divergence. Below is Bitcoin’s NVT indicator. Each time the NVT indicator has remained in the red zone for a significant period of time a 30-40% decline has followed. Additionally, the BitMEX funding and premium index has just ticked into negative territory. A move of this sort suggests that price is in neutral to oversold territory. While price may be currently oversold, the lack of historic support after May’s parabolic increase could send Bitcoin down another 15-20%.
Cryptocurrency News
TRON CEO, Justin Sun, has paid $4.57 million for lunch with Warren Buffett. The money will be donated to charity and Buffett will presumably have to suffer through Sun’s elevator pitch.

Image source: Mati Greenspan, Senior Market Analyst at eToro.
Conclusion
Bitcoin has now fallen below the critical support level of $8.2k. Until Bitcoin increases above this level, a harsh pullback to the $6k level is still in the cards. If a drop of this sort should occur, look for an ideal buying opportunity. Overall, May’s rally occurred too fast without a pullback. Also, no new money has entered the space and institutions consist of only 7% of all crypto trading volume. Furthermore, nothing fundamental has powered Bitcoin’s rally throughout the month of May. Therefore, it is more likely that we will see a larger pullback within the coming weeks.
Disclaimer: The author of the article owns Bitcoin.