
Cryptocurrency
Bitcoin Falls: Will $5k Hold?
Yesterday, Bitcoin fell $400 (7.5%) after news broke that Tether reserves where used to cover an $850m loss for the cryptocurrency exchange Bitfinex. Uncertainty and panic selling followed as the price fell by $400 in just two hours. Now traders are contemplating whether the recent price decrease is a buying opportunity or a signal for […]
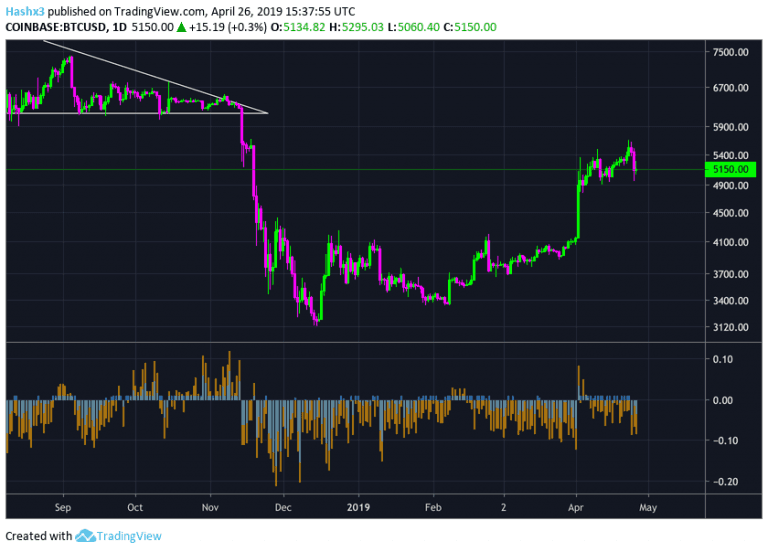
Yesterday, Bitcoin fell $400 (7.5%) after news broke that Tether reserves where used to cover an $850m loss for the cryptocurrency exchange Bitfinex.
Uncertainty and panic selling followed as the price fell by $400 in just two hours. Now traders are contemplating whether the recent price decrease is a buying opportunity or a signal for a larger pullback.
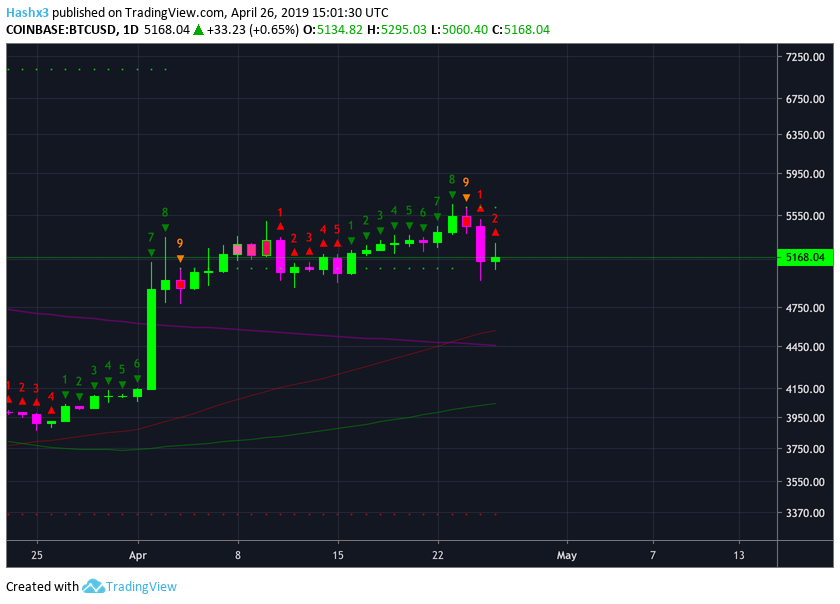
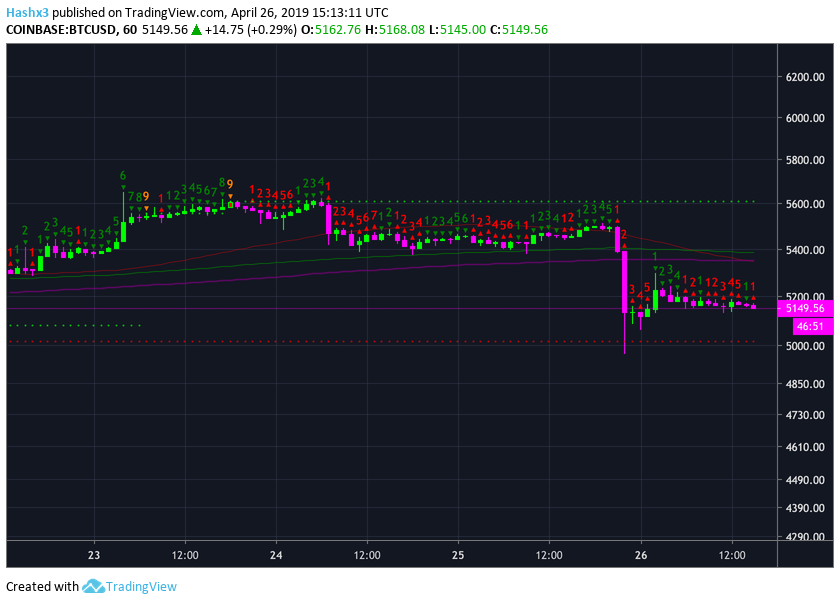
If you were trading based on the sequential indicator in the charts below, you would have had multiple indicators telling you to sell as the trend was nearing exhaustion. Looking back, price peaked at a green 9 across a variety of time frames all listed below.
Daily
 1hr
1hr
3hr
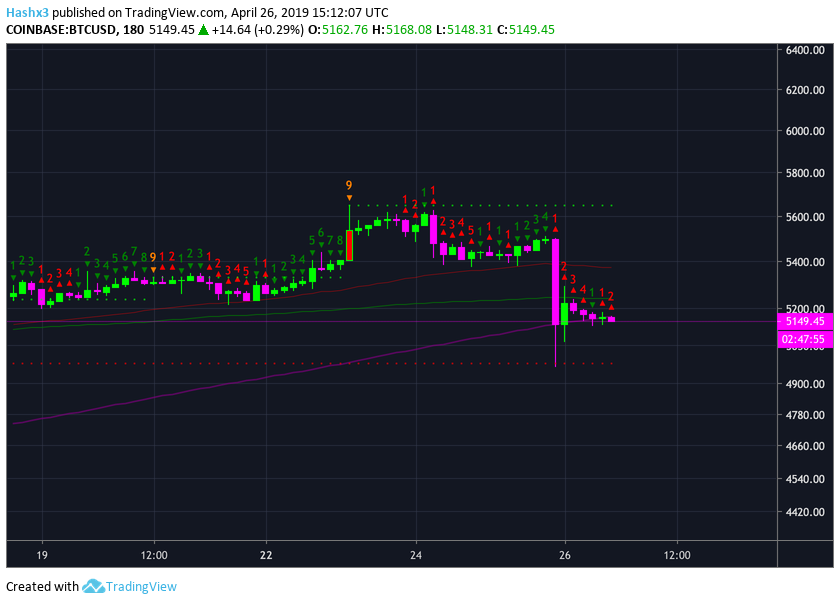
4hr
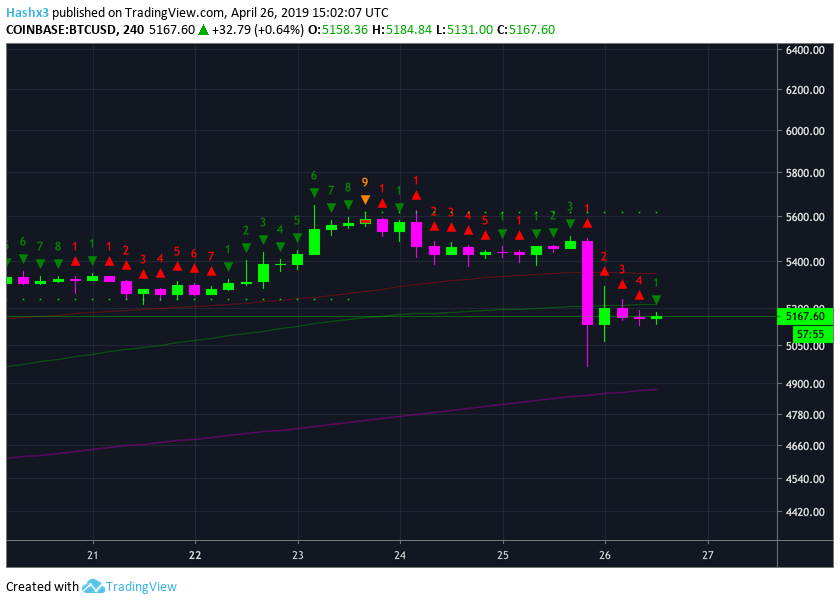
The sequential indicator is not magic and it certainly did not predict the Bitfinex news which impacted the market severely. However, the sequential indicator will tell you when the trend is nearing exhaustion. When the upward trend is nearing exhaustion (which it was), negative news can have a much larger impact than previously anticipated. This is presumably what amplified the price drop which occurred yesterday.
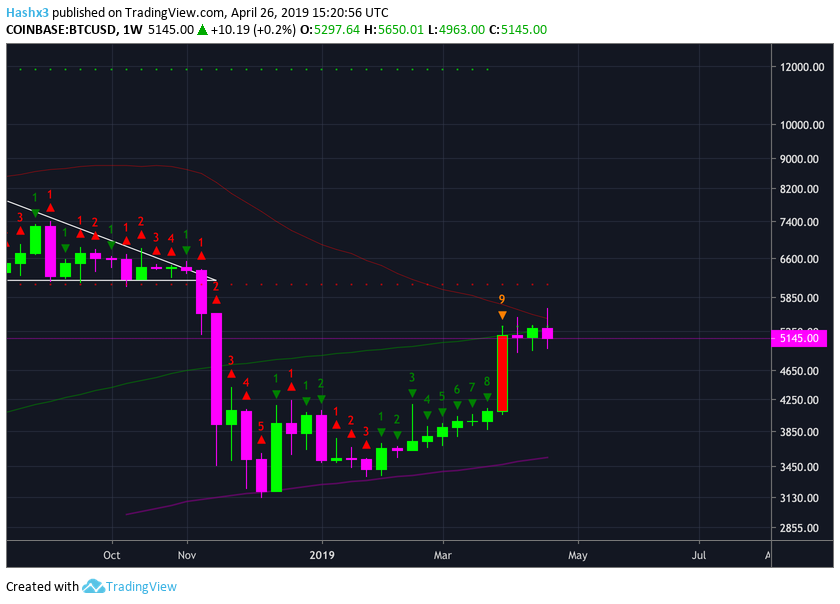
The weekly chart above is where things start to become interesting.
On the sequential indicator, we are currently at a green 3 of 9 candle which is looking to close below the 200MA (red). If Bitcoin is rejected by the 200MA and falls below $5k, we could easily test support at $4k. If Bitcoin finds support at $4k, consolidates, and then continues to increase back above $5k, that is further indication that we have made a true higher low and have bottomed at $3.1k. This kind of pullback would be very healthy for the market in its current state.
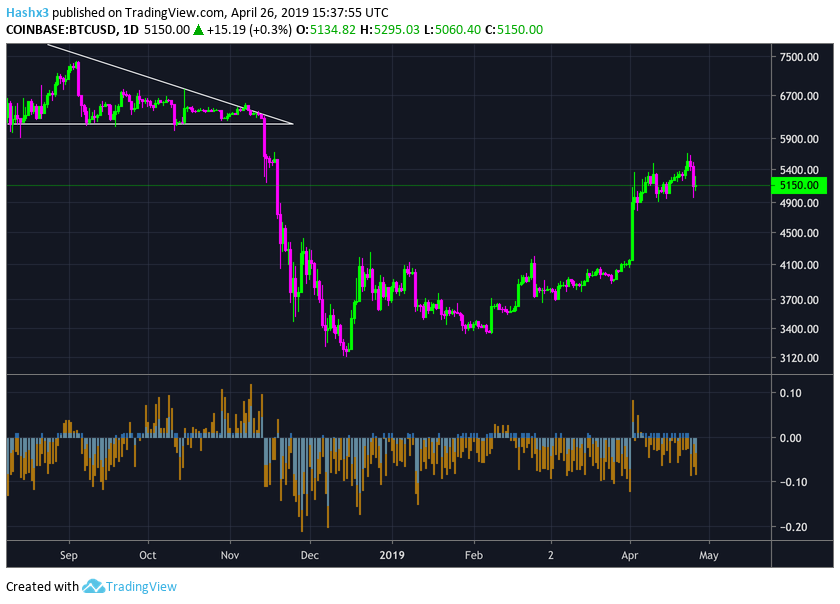
An interesting indicator located on the chart above is the BitMEX Funding and Premium Index.
Essentially, the script created by NeoButane is a counter indicator which displays whether the majority of the market is either long or short. Since the market tends to punish the majority, the script is used as a counter indicator to trade the opposite of whatever the overall market is doing. As you can see above, the majority of the market was long prior to the drop below $6k. After Bitcoin recently broke above $5k, the market became bullish for one of the first times in a while. However, even with the majority of the market talking bullish on Twitter, the BitMEX Funding and Premium Index shows that the majority of the market is still bearish. Is this a good sign for the bulls? Temporarily yes, but due to the lack of support Bitcoin is still in a ‘falling knife’ phase where further panic selling is certainly plausible.
Disclaimer: This is not financial advice. I am not a financial adviser. Please do your own research and make objective decisions. The author of the article owns Bitcoin.