
Cryptocurrency
Bitcoin Flash Crashes 20% in Two Hours
Bitcoin flash crashes 20% after a monthly increase of 50%. While Bitcoin has made substantial gains this month, a pullback was likely to occur based on many oscillator indicators. Currently, Bitcoin has rebounded to $7.2k after reaching a low of $6.2k. On the daily chart above, Bitcoin’s sequential indicator is beginning a red 1 candle. […]

Bitcoin flash crashes 20% after a monthly increase of 50%. While Bitcoin has made substantial gains this month, a pullback was likely to occur based on many oscillator indicators. Currently, Bitcoin has rebounded to $7.2k after reaching a low of $6.2k. On the daily chart above, Bitcoin’s sequential indicator is beginning a red 1 candle. A red 1 candle of this nature is not typical because of the manner of the crash. The crash happened too quickly and the recovery occurred too quickly to qualify as a healthy pullback. Therefore, if you’re trading sequential it would be better to wait for a red 2 or 3 to gather enough conviction to place a trade.
4 Hour
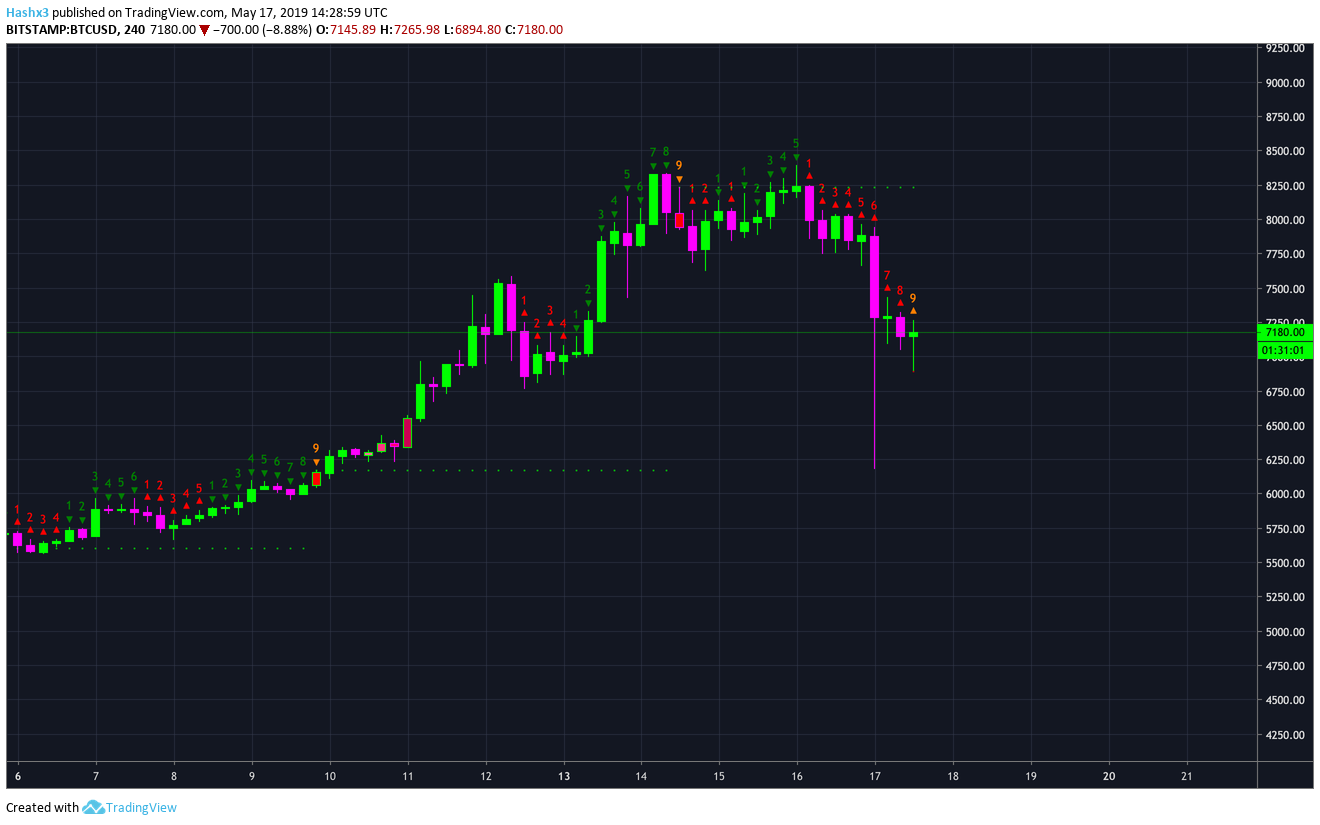
The sequential indicator on the 4 hour chart above has reached a red 9. For now, downward momentum or stagnation is likely to continue as price consolidates around $7.2k.
Shorts
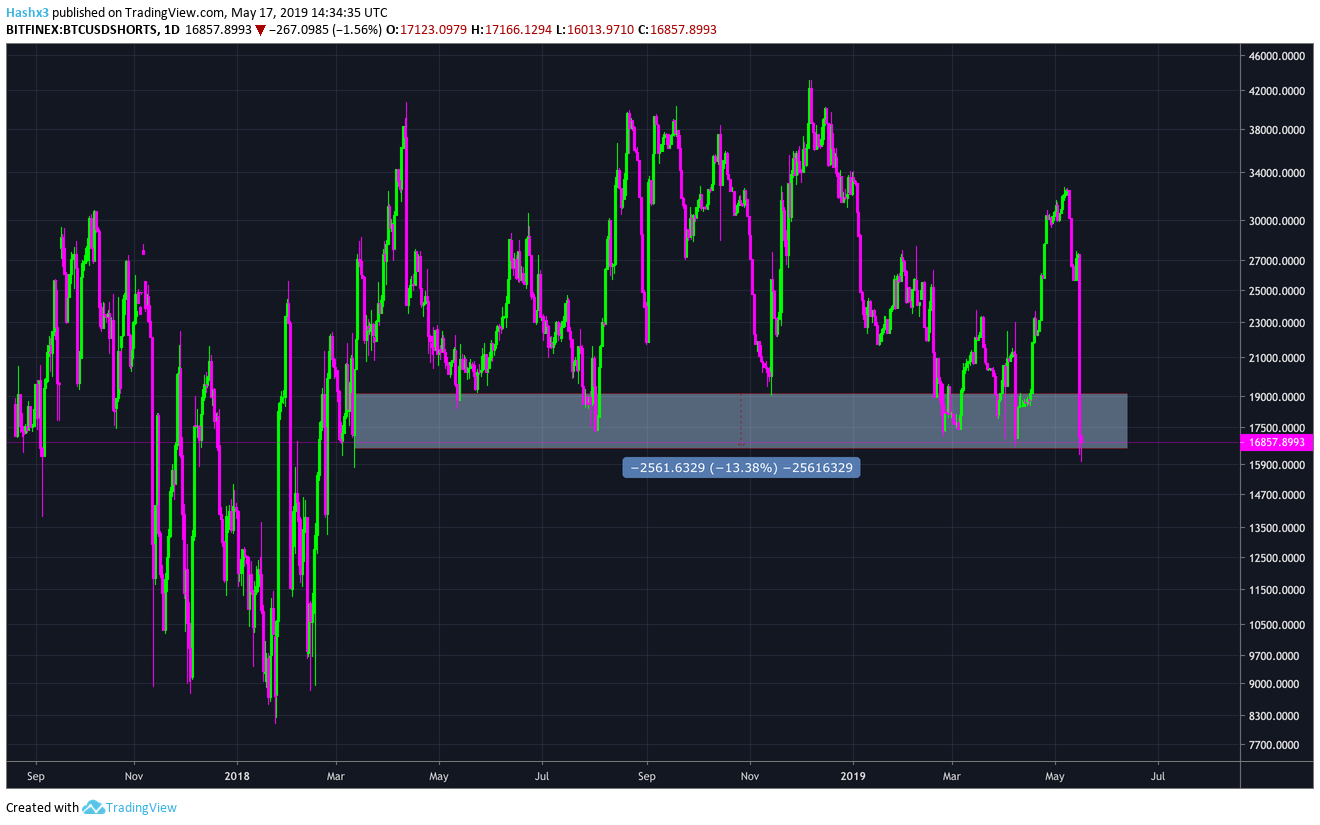
Yesterday’s article highlighted the large amount of shorts which have recently exited the market. Every time Bitcoin shorts have declined to the highlighted channel above, a large price decrease has followed. Considering shorts are still exiting the market, the pullback may not be completely over.
Oscillators
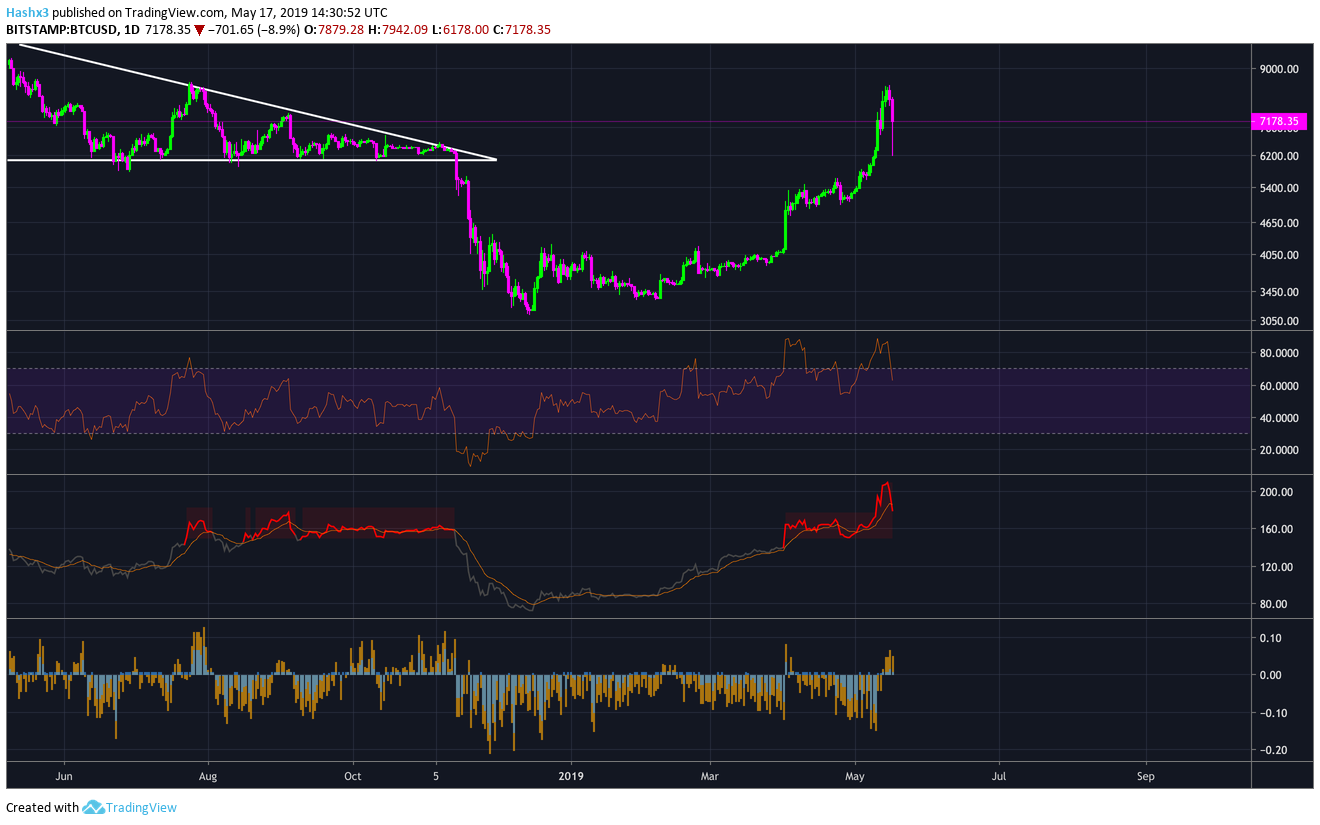
The daily chart above includes Bitcoin’s RSI, NVT Ratio, and BitMEX Funding and Premium Index. Bitcoin’s RSI has now dropped back into neutral territory after our recent price decrease. Bitcoin’s NVT (Network Value to Transactions) Ratio is still in dangerously overbought territory. Lastly, the BitMEX Funding and Premium Index is currently in overbought territory as well. However, these oscillators have been telling us Bitcoin has been overbought since we broke above $6k. Therefore, they give us a perspective of the macro trend which implies we are still waiting for a 30-40% pullback to previous support around $4k-$5k.
Cryptocurrency News
Yesterday, the controversial stable coin Tether was ordered to halt all transfers to Bitfinex by the Supreme Court of New York. While the market was certainly overdue for a pullback, this negative news may have been the catalyst which sent the market to a low of $6.2k. Additionally, Consensus, one of the largest cryptocurrency conferences of the year, has ended. In previous market cycles, Bitcoin has rallied before Consensus only to dump after the fact.
Conclusion
Bitcoin’s decline comes as no surprise. For now, our indicators are leaning bearish as Bitcoin consolidates around $7k-$7.2k. Price could easily fall back to previous support levels amidst the sell off. However, if the bulls can somehow gather momentum to break above $9.4k (the 0.382 fibonacci level), there are no significant resistance levels until new all-time highs.
Disclaimer: I am not a financial advisor. Nothing in this article should be considered financial advice. Please do your own research and make objective decisions. The author of the article owns Bitcoin.