
Cryptocurrency
Bitcoin Hovering Over $8,000: Post Consensus Dump Incoming?
Bitcoin is hovering around $8k as we reach the middle of the week. Last week’s upward price action has pointed mass media attention back onto Bitcoin. Below is a chart of Google trends search results for ‘Bitcoin’. Currently, Bitcoin’s search rate is the highest it has been since April 1st, 2018. Weekly Looking at the […]

Bitcoin is hovering around $8k as we reach the middle of the week. Last week’s upward price action has pointed mass media attention back onto Bitcoin. Below is a chart of Google trends search results for ‘Bitcoin’. Currently, Bitcoin’s search rate is the highest it has been since April 1st, 2018. 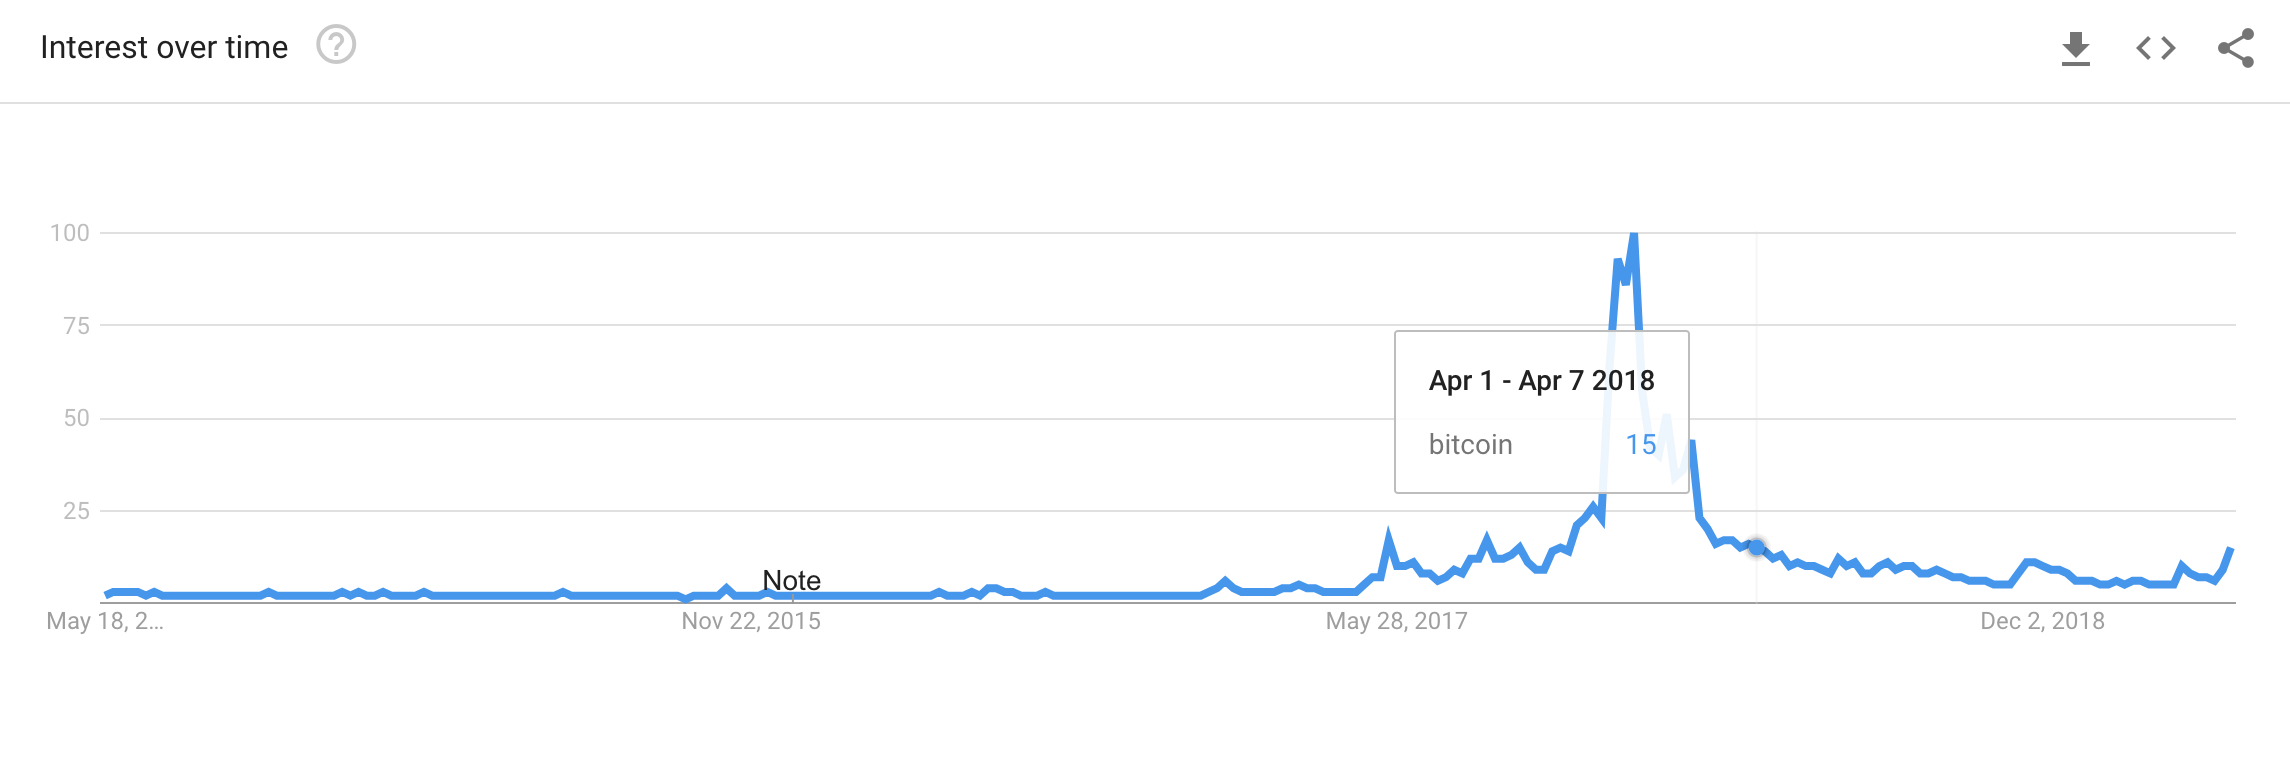
Weekly
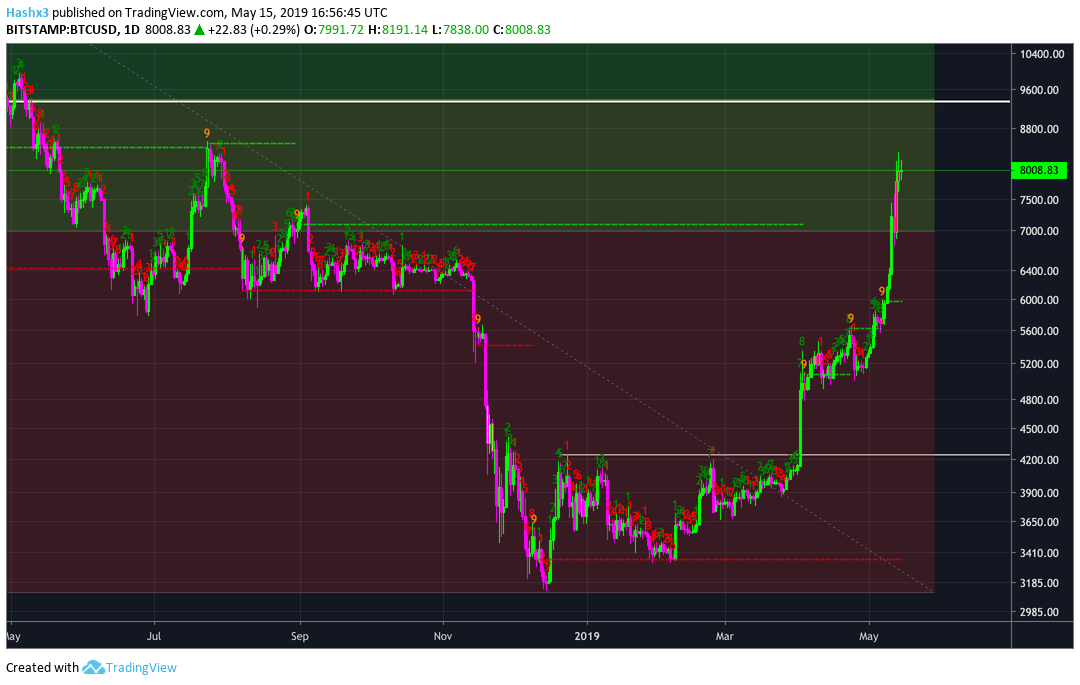
Looking at the weekly chart above, Bitcoin’s most critical resistance is now the 0.382 fibonacci level at $9.4k. In a previous article we talked about how gold was rejected by the 0.382 fibonacci level in 2016. As a result, gold remains under this level to this day.
Additionally, Bitcoin’s weekly sequential indicator is on a green 6 of 9 candle, therefore, we should have three more weeks of potential upside. If Bitcoin continues to climb to $9.4k to reach a weekly 9 candle, there will be an optimal opportunity for the bulls to take profit before a potential pullback. However, Bitcoin’s previous 5 and 6 candles had a massive explosion to the upside so price has a high likelihood of pulling back before reaching a weekly 9 candle in three weeks. Surprisingly, there is no significant resistance past the $9.4k level and if Bitcoin breaks above this level in the coming months price will likely make new all-time highs.
Daily
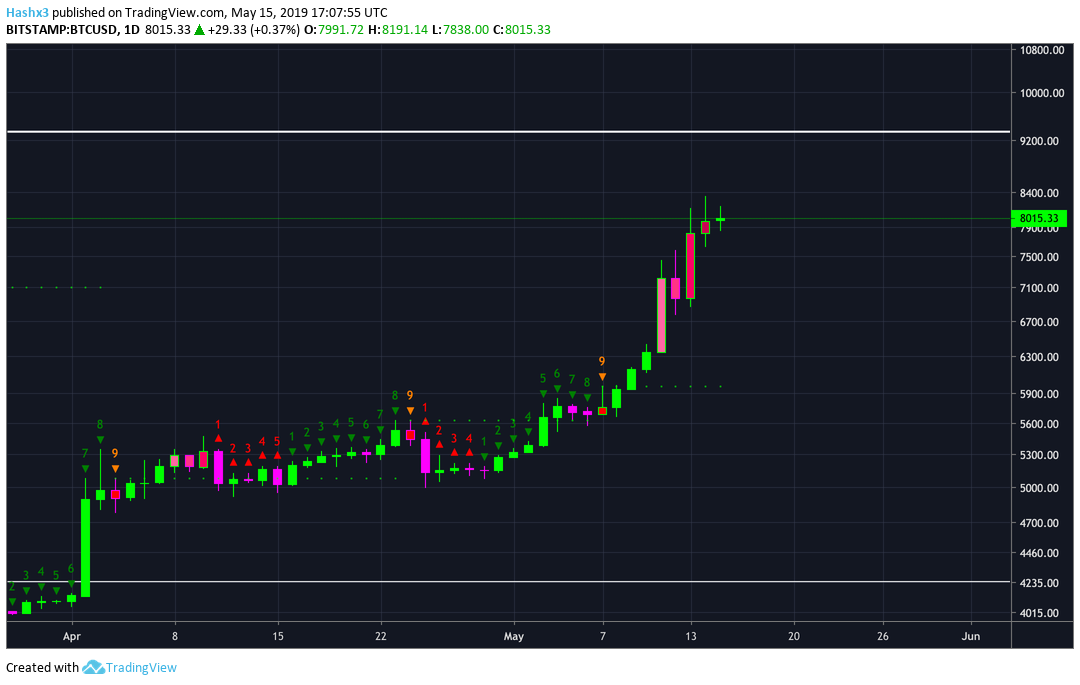
Currently, Bitcoin is on a green 8 on the daily chart above. As a result, price should begin a temporary top within the next day or two.
4 Hour
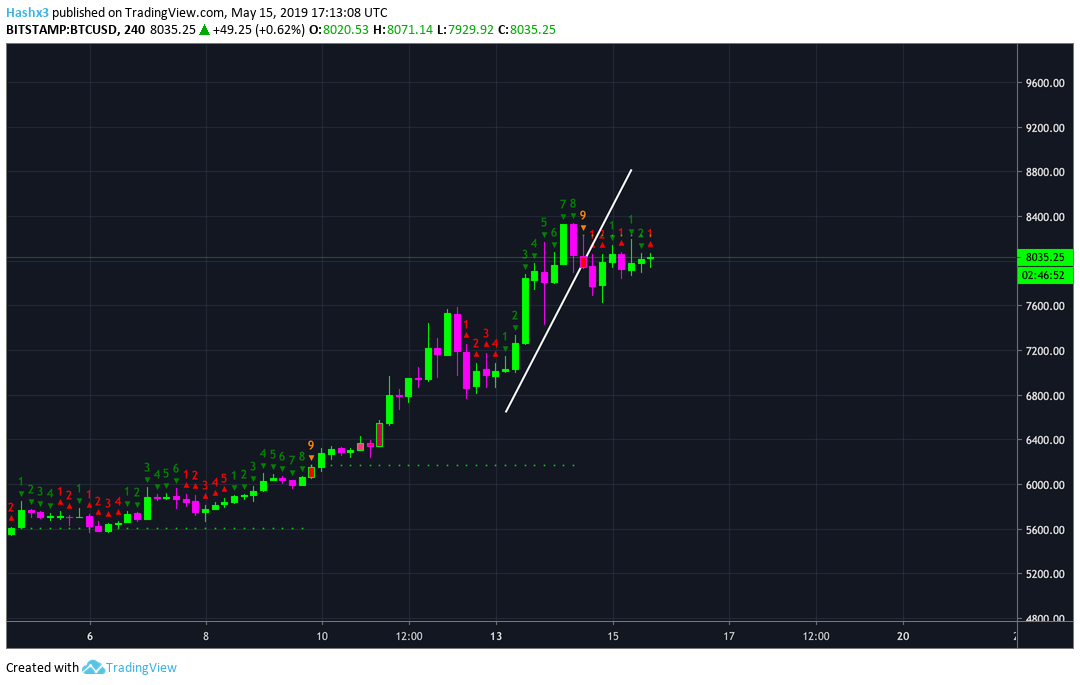
Bitcoin is now on a red 1 after topping on a green 9 about a day ago. Price is now consolidating and bullish momentum is stalling temporarily.
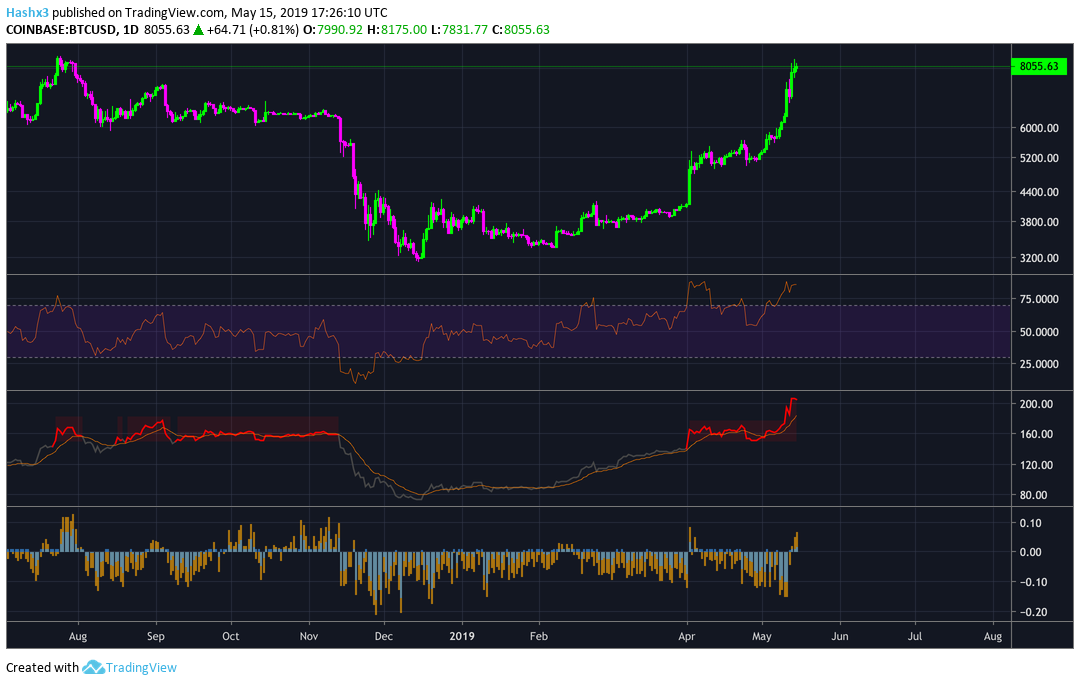
Oscillators
Above is Bitcoin’s RSI, NVT ratio, and BitMEX Funding and Premium Index. Currently, all of our oscillators are in overbought territory. However, these same oscillators have been telling us Bitcoin has been overbought since $5.2k. Moreover, these indicators present evidence of why you should be skeptical of this rally. The bull trap thesis still has merit.
Conclusion
If price can get back to $8.3k, expect another bullish price surge to take us all the way to $9k. If we continue to consolidate, look for a temporary pullback followed by a rally to test $9.4k with the next three weeks.
Disclaimer: I am not a financial advisor. This is not financial advice. Please do your research independently and make objective decisions. The author of the article owns Bitcoin.