
Cryptocurrency
Bitcoin is at a Critical Crossroads
There is an old saying in trading and investing; ‘Markets can be very generous when giving second and third chances, but they are very stingy when it comes to giving fourth and fifth chances.’ When observing the chart below, it is apparent that bitcoin will be testing this theory very shortly. The cryptocurrency market […]

There is an old saying in trading and investing; ‘Markets can be very generous when giving second and third chances, but they are very stingy when it comes to giving fourth and fifth chances.’ When observing the chart below, it is apparent that bitcoin will be testing this theory very shortly.
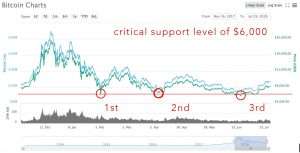
The cryptocurrency market first gave investors an opportunity to buy during a February low of around $6,100. The second opportunity came in April at a price of about $6,600. The third opportunity occurred recently in June between the price range of $5,800 and $6,200.
Currently, bitcoin is experiencing a relative bull run, however if this bull run is not able to break the resistance level of $10,000 and sustain itself, a fourth bottom could crash BTC into oblivion. A decline such as this is unlikely, but if the critical support level of $6,000 is broken it is possible that bitcoin will follow the same decline gold experienced throughout 2013 – 2016.
In contrast, it is probable that bitcoin will continue to increase if it breaks the resistance level at $8,250 – $8,400. This price range also lines up with the .618 Fibonacci retracement level. Above all, we are certainly at a crossroads when it comes to this profound digital asset.
Below is the 10 year gold price history. During the years of 2009 – 2011 gold experienced a prominent increase.
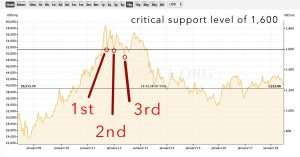
Similar to bitcoin, gold had a harsh pull back after doubling during these years. The gold market gave traders three opportunities for optimal entry points. During the third gold run up, investors were expecting the price of gold to soar past its previous high of around $1,800. Despite the optimistic enthusiasm, this prediction proved to be incorrect and gold declined below the critical support level of $1,600. Ultimately, this led gold to endure a merciless bear market for the next three years.
Today, at a price of about $8,200, bitcoin is facing a similar crossroads as gold once did. If bitcoin’s critical support level of $6,000 is broken, then the bear market is likely to reemerge.
Aside from long term predictions, the short term appears to be very bright for bitcoin. As you can see below, bitcoin experienced a candlestick rise throughout the last few weeks. This was followed by a healthy pullback.
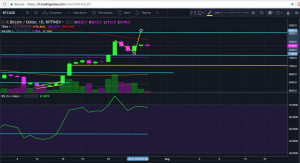
Fortunately, bitcoin has found a new target of $8,800. The current pull back created the opportunity for a textbook bull flag to be formed throughout the coming weeks. A future bull flag would take the price of bitcoin to $8,800. If this resistance point can be broken there may be nothing between bitcoin and $10,000.
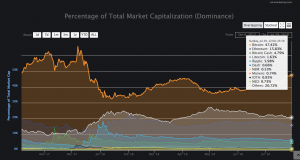
Lastly, a noteworthy statistic to consider is bitcoin’s market cap dominance of 47.4%. Increasing levels of bitcoin dominance indicate that the safest and most profitable cryptocurrency investment is currently bitcoin. Altcoin speculation can be vastly opportunistic during a massive bull run, but during these times of critical uncertainty altcoins have been getting crushed by bitcoin. While some Altcoins have the potential to outperform bitcoin in the current market state, it has been very rare. Current altcoin speculation is equivocal to attempting to catch falling knives. For traders and investors, it may be more profitable to wait for bitcoin dominance to stagnate before entering the altcoin market. Just my opinion, NOT financial advice.
Disclaimer: This is not financial advice. Please do your own research and make objective decisions. Please do your own due diligence. This article is intended to educate readers about the potential price movement of bitcoin. The author of the article owns cryptocurrency.
Image Credits:
https://coinmarketcap.com/currencies/bitcoin/
https://goldprice.org/gold-price-history.html
https://www.tradingview.com/chart/?symbol=BITFINEX:BTCUSD
Sources:
Alessio Rastani https://www.leadingtrader.com/
https://www.youtube.com/channel/UCOaew10hdmtfa0MinTjOBqg?&ab_channel=CryptoKirbyTrading
https://www.youtube.com/channel/UCnJjRjmthxPCoQaAL44tR6g?&ab_channel=AlessioRastani
https://www.youtube.com/channel/UCrYmtJBtLdtm2ov84ulV-yg?&ab_channel=IvanonTech