
Cryptocurrency
Bitcoin: Out of Gas or Start of Bull Market?
After many weeks of stagnation, Bitcoin has finally broken to the upside. In our last publication (March 31st), we claimed, ‘If Bitcoin can break above the critical resistance level at $4.2k, then there is a high probability the bulls will drive price up to $4.6k or even $5k with the 128 MA (green) acting as strong […]
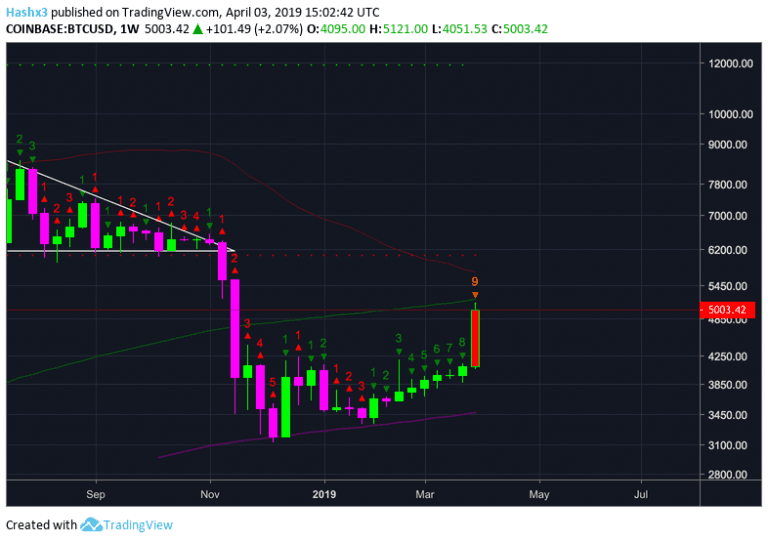
After many weeks of stagnation, Bitcoin has finally broken to the upside. In our last publication (March 31st), we claimed, ‘If Bitcoin can break above the critical resistance level at $4.2k, then there is a high probability the bulls will drive price up to $4.6k or even $5k with the 128 MA (green) acting as strong resistance.’ When looking at the weekly chart above, Bitcoin’s price increase has led us all the way up to the 128MA (green) which has been a critical level throughout Bitcoin’s history. Now Bitcoin has begun to form tentative support at $5k while forming a 9 candle on the weekly chart.
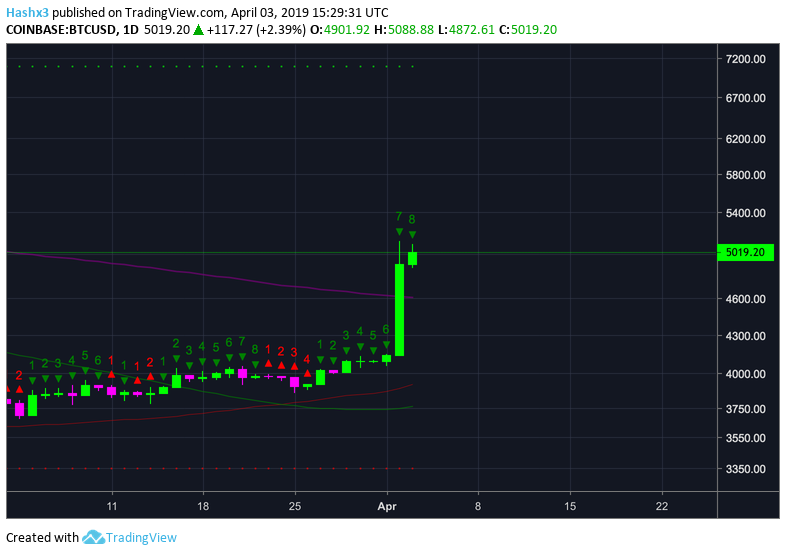
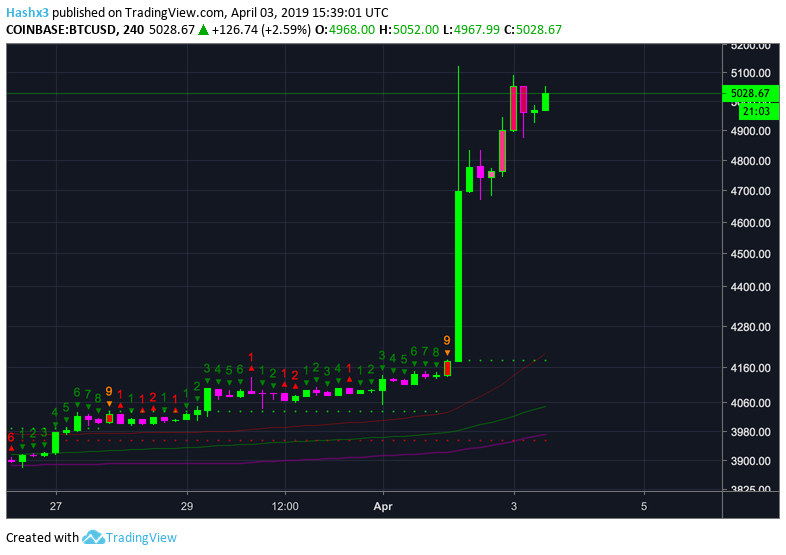
When viewing the TD Sequential Indicator across multiple time frames, many of the charts are at, or nearing, a green 9 candle. This includes the weekly chart (above), the daily chart (below) and the 4hr chart (below), as well as the three-day and 12hr charts.
Daily
4 Hour
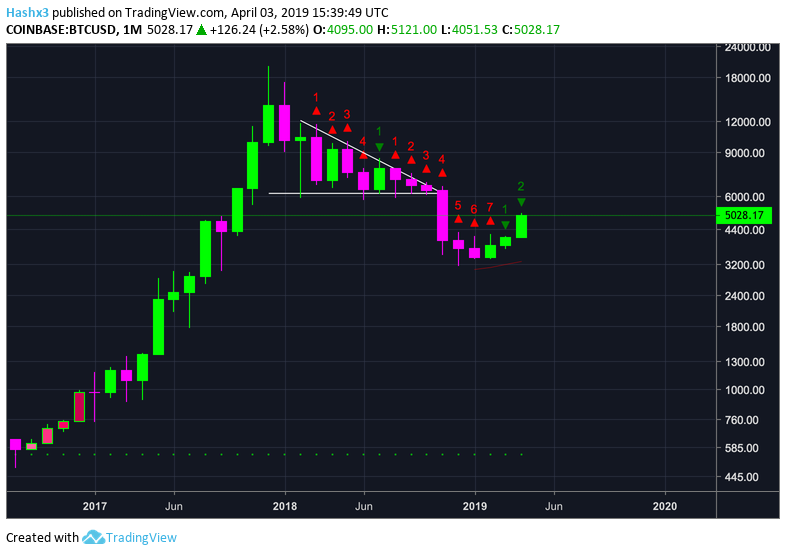
The monthly chart below is on a 2 of 9 candle and is the only chart which is currently bullish.
If four or more time frames reach a green 9 candle, then the Sequential Indicator is telling you to short. Although it can be dangerous to short Bitcoin during times of fomo and uncertainty, the Sequential Indicator is suggesting bearish activity is coming in the form of a healthy pullback at the very least. Additionally, Bitcoin’s daily RSI is at 90, a level which Bitcoin has not seen since December 2017 during the height of crypto mania. If we were to pullback from $5k, the first major area of support would be $4.5k – $4.6k which also aligns with the daily 200MA (purple).
While many indicators are suggesting the recent move may be coming to a halt, the same was true when Bitcoin was at $7.5k in the fall of 2017. At that point in time, there were many indicators suggesting the trend was nearing exhaustion, yet Bitcoin almost tripled and went to $20k only weeks later. It can be difficult to predict massive price movements in exotic assets with low market capacities. As traders, all we can do is use TA to measure the probabilities of price action while practicing responsible risk management.
Disclaimer: Nothing in this article should be taken as financial advice. I am not a financial adviser. Please do your own research and make responsible decisions. The author of the article owns Bitcoin.