
Cryptocurrency
Bitcoin Out of Gas? Pullback to $4.6k Imminent?
The Bitcoin stalemate continues as the bulls and bears fight over the $5.2k price channel. When viewing Bitcoin on the 4hr chart above, a tentative head and shoulders pattern appears to be forming. Volume peaked at the beginning of the left shoulder and then increased again as the head was formed. According to the […]
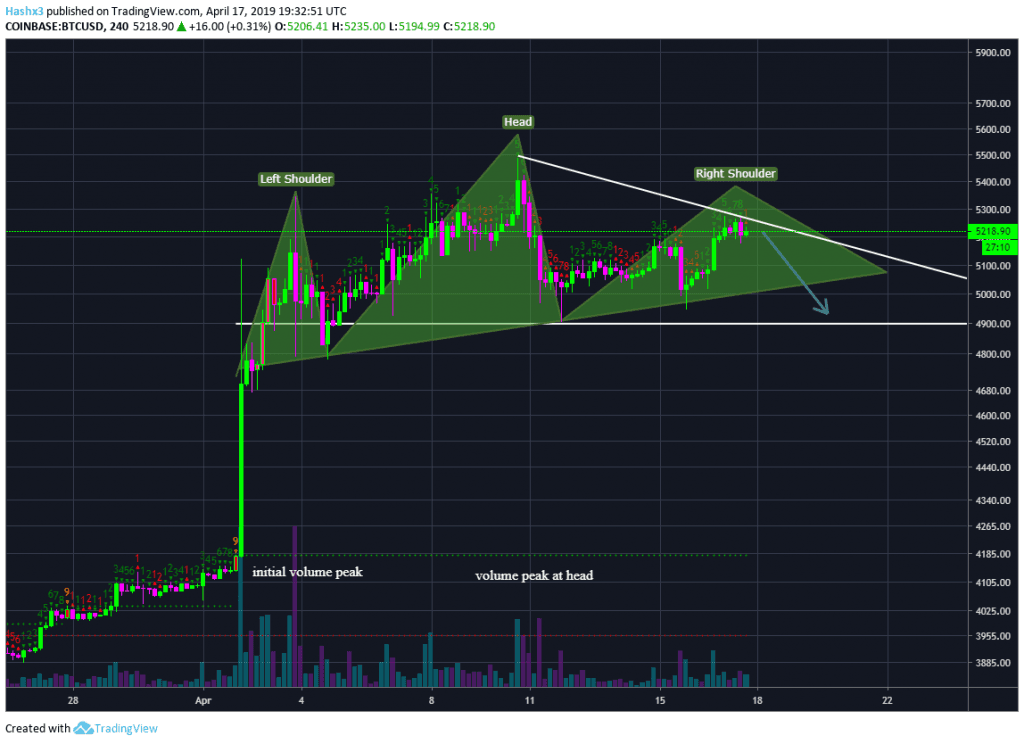
The Bitcoin stalemate continues as the bulls and bears fight over the $5.2k price channel. When viewing Bitcoin on the 4hr chart above, a tentative head and shoulders pattern appears to be forming. Volume peaked at the beginning of the left shoulder and then increased again as the head was formed. According to the sequential indicator, we are currently on a red ‘1’ candle which means there is room for potential downward price action throughout the rest of the week. Declining volume has also led some traders to speculate on the likelihood of another descending triangle formation emerging. A break below the potential descending triangle would point us to a price target of roughly $4.6k.
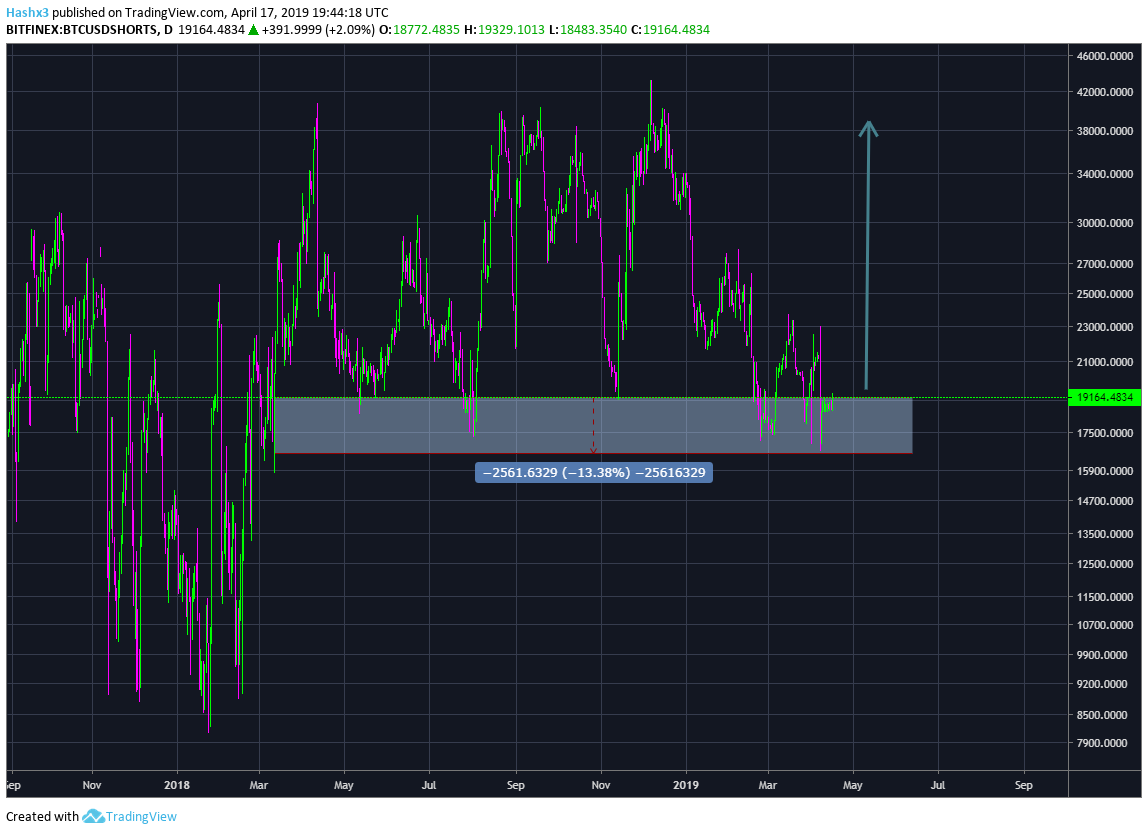
When viewing the amount of Bitcoin shorts above, we are currently in an interesting zone. Ever since February 2018, we haven’t gone below the channel highlighted above. Each time the shorts decline to this channel, they react by ripping to the upside while coinciding with a significant drop in Bitcoin’s price. Price typically drops and then shorts stack up because everyone suddenly turns bearish. The recent price increase is likely a result of a very small short squeeze.
From a bullish perspective, what does Bitcoin need to do to pump? First, Bitcoin needs to break above the $5.2k resistance level. Volume must then increase and price must take out both the head and shoulders pattern by getting above the left shoulder and the head, and finally Bitcoin must break out of the tentative descending triangle formation by breaking above the descending trend line at roughly $5.2k. Due to historic support and resistance levels, the battle between the bulls and bears will probably be the most intense throughout the $5.5k – $6k price channel.
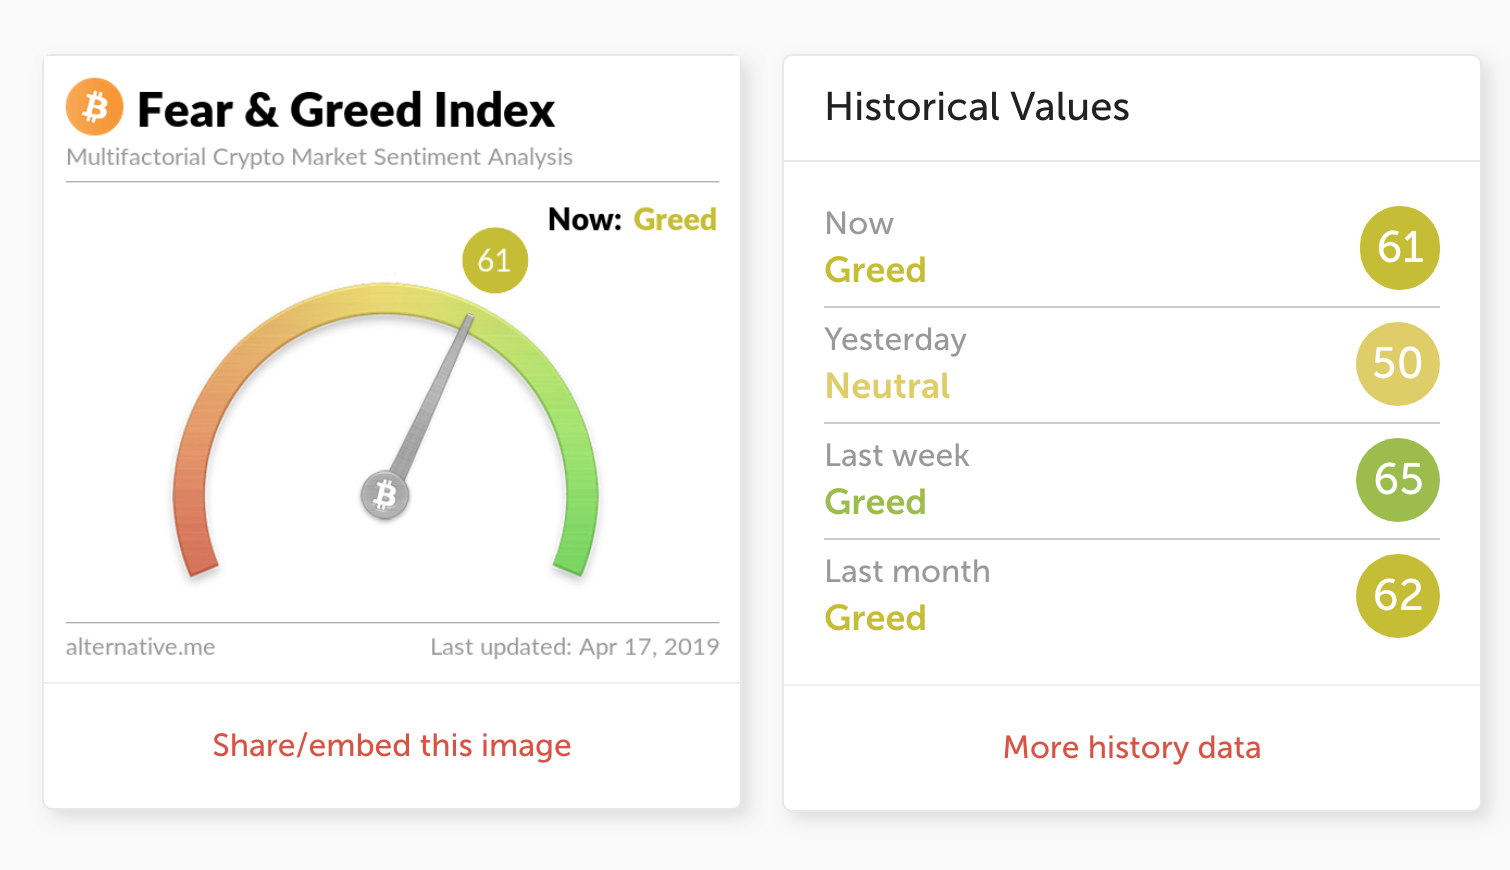
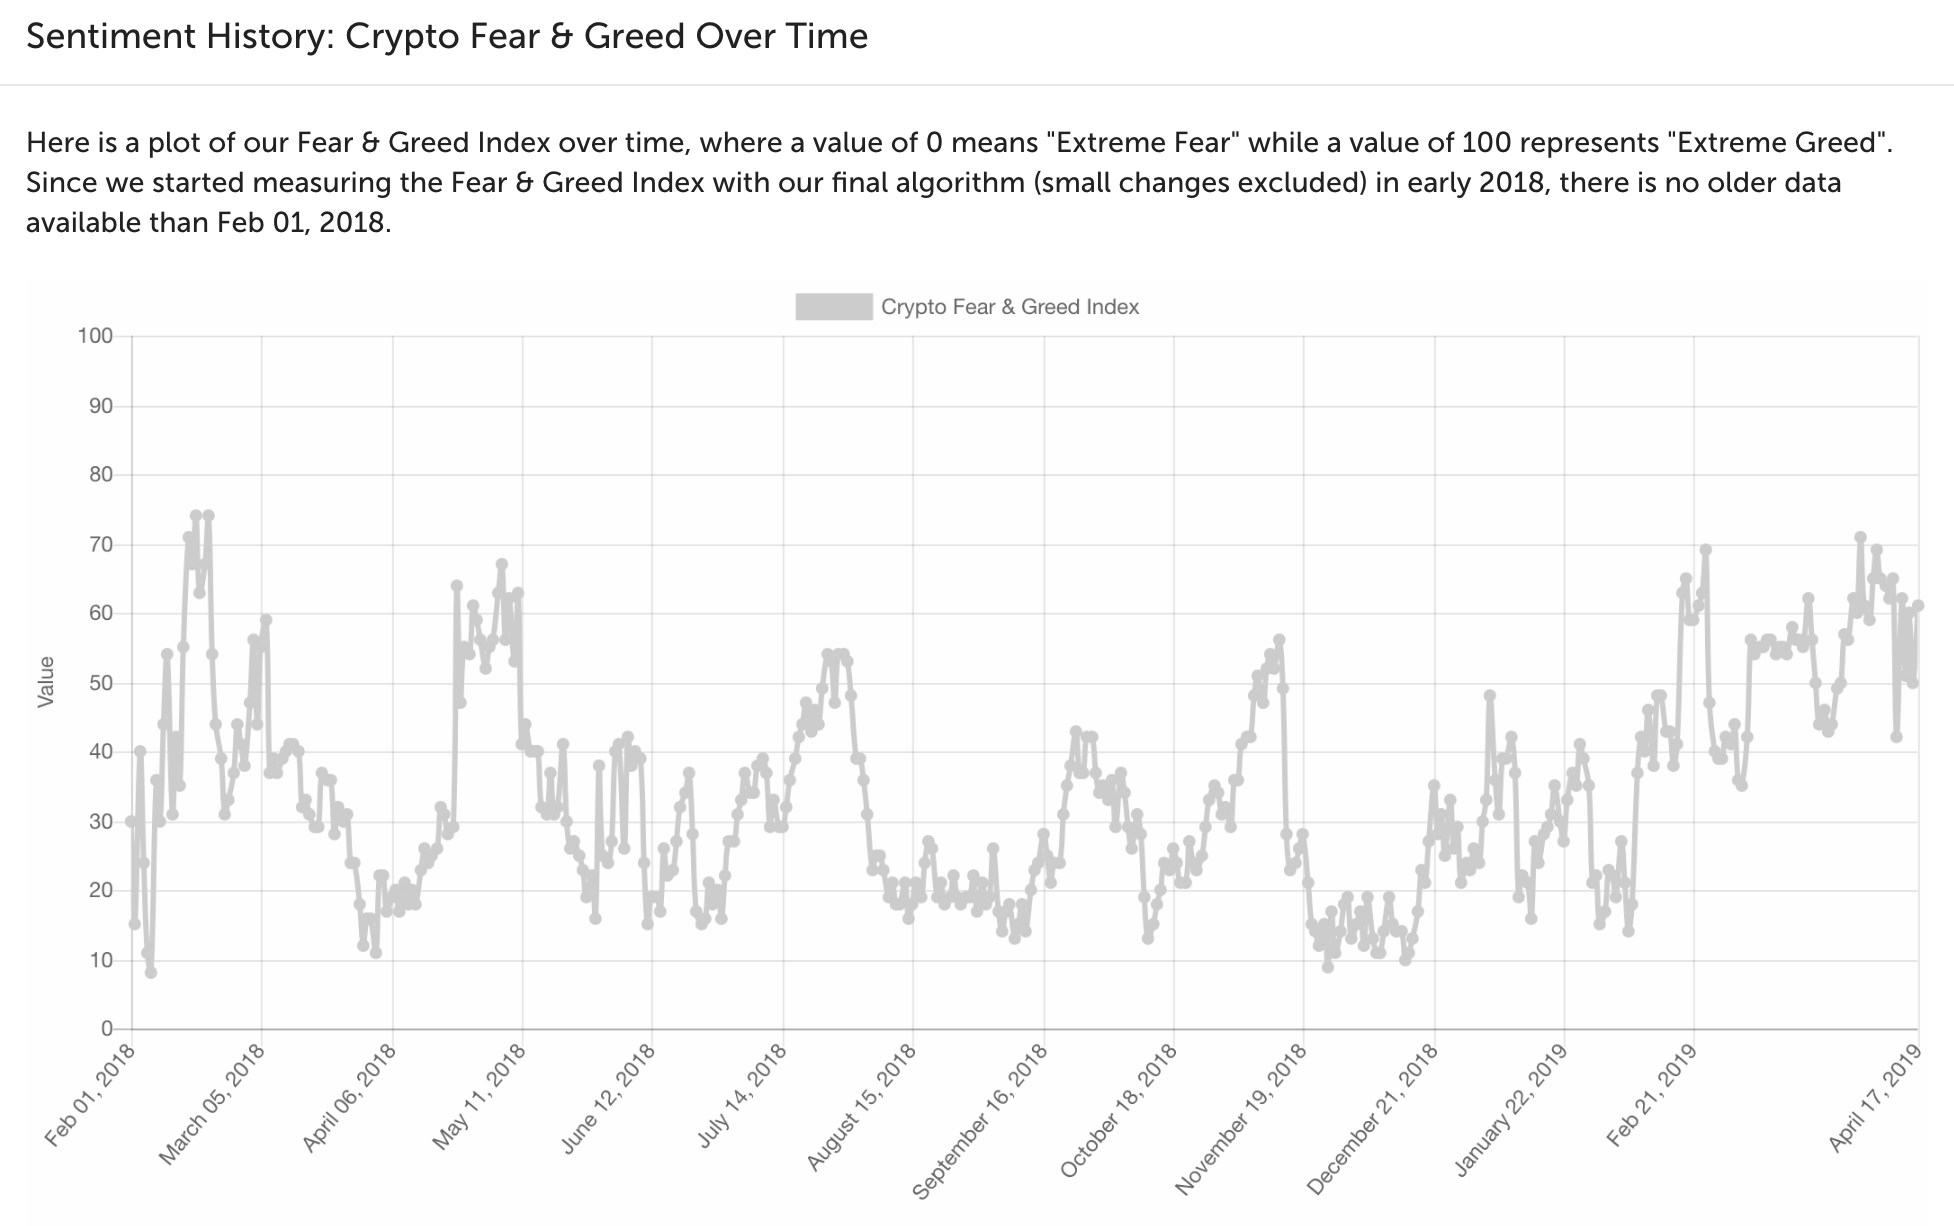
Above, there is another interesting indicator: The Crypto Fear and Greed Index (also available here). Currently, the Fear and Greed Index is at 61. As you can see on the chart below, every time we have entered the channel between 60-70 on the Fear and Greed Index, Bitcoin has dumped in price shortly afterward. We’ve now been greedy for a long time and a dump may be upon us which short sellers won’t want to miss.
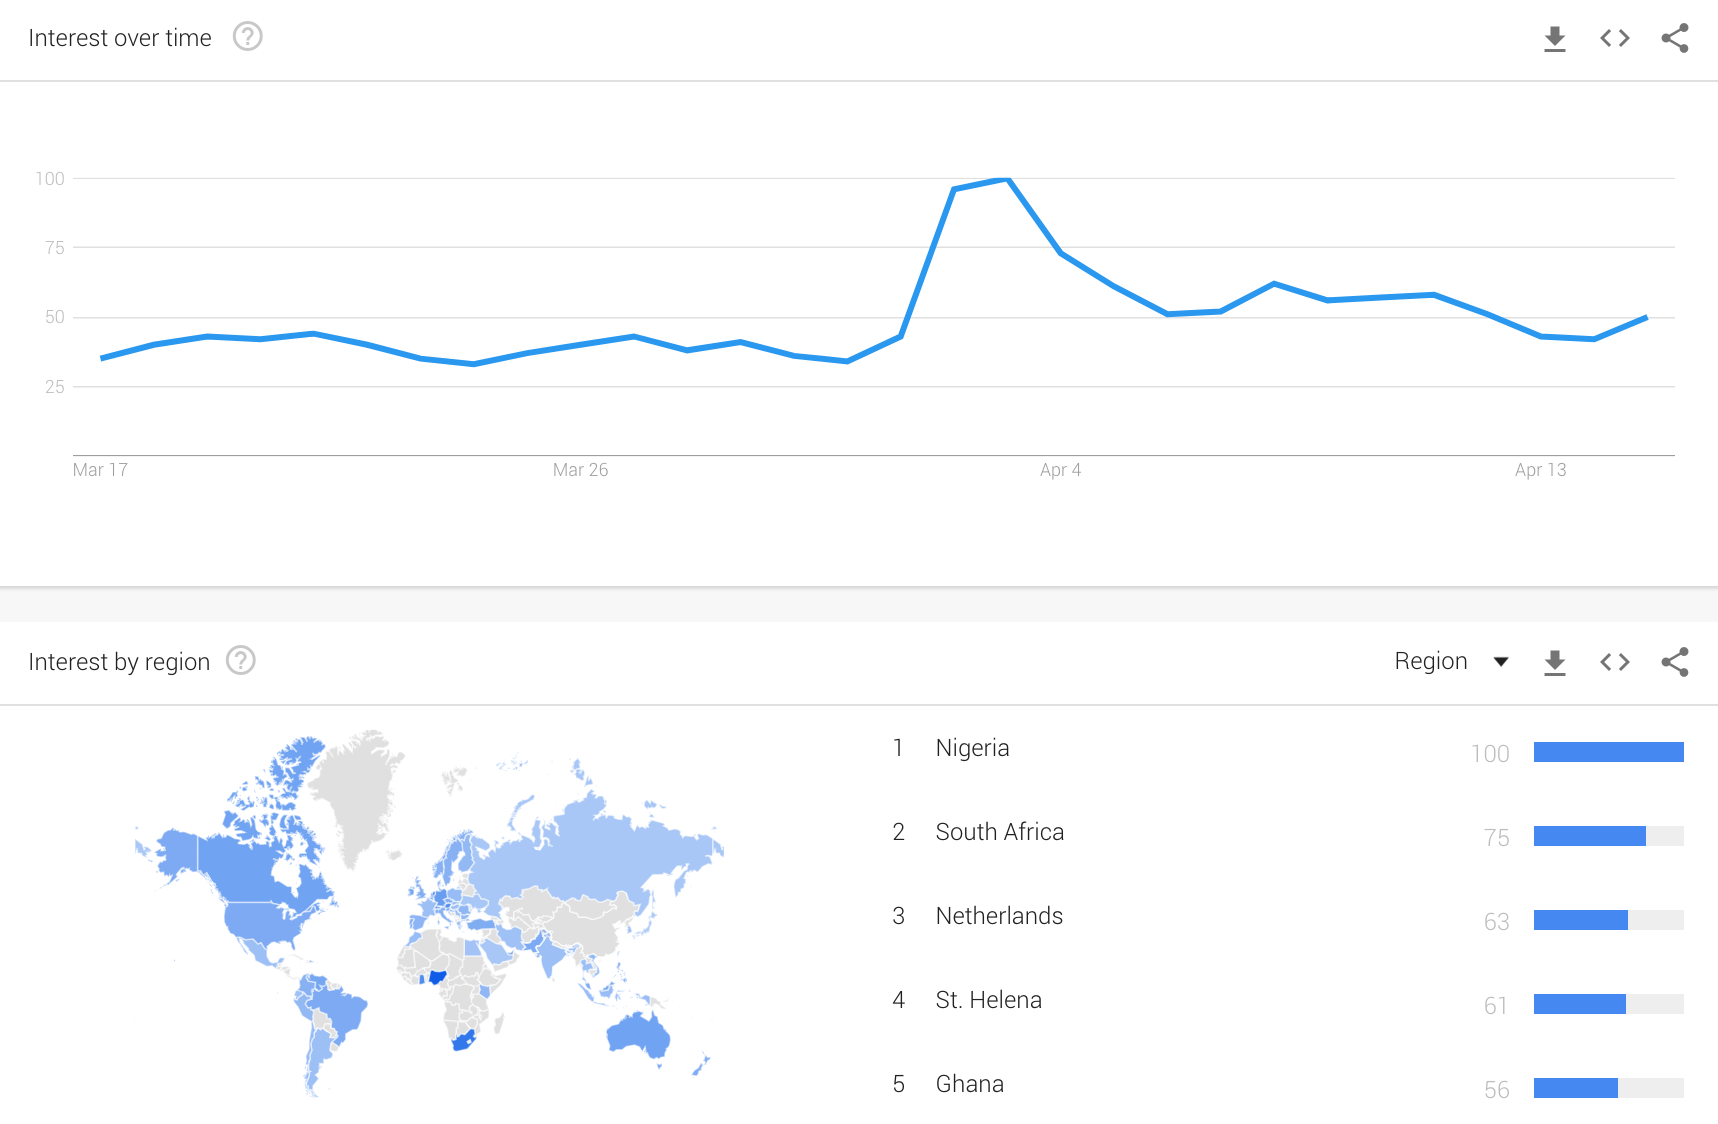
Additionally, Bitcoin has declined in Google search data above. During the height of Bitcoin’s recent increase on March 31st, Google search trends for Bitcoin also peaked around this time. Search trends have since fallen which may indicate a lack of new investors and overall interest in the space. Most notably, search trends for Bitcoin have dropped from 100 to 42, a 58% decline in search volume since the start of April.
The bulls are still holding strong at the $5k – $5.2k level, however, most current indicators are showing bearish characteristics.
Disclaimer: I am not a financial adviser. This is not financial advice. Please do your research independently and make objective decisions. The author of the article owns Bitcoin.