
Cryptocurrency
Bitcoin Price Analysis: Tension Building for a Bigger Move?
Throughout the past week, Bitcoin has continued to flutter around the $5.3k area. Tension has been building within the trend and the technicals are setting up for a large incoming move. As of now, the bullish perspective is seeing Bitcoin forming an ascending triangle (white) which is a bullish continuation pattern. Textbook ascending triangles break […]

Throughout the past week, Bitcoin has continued to flutter around the $5.3k area. Tension has been building within the trend and the technicals are setting up for a large incoming move. As of now, the bullish perspective is seeing Bitcoin forming an ascending triangle (white) which is a bullish continuation pattern. Textbook ascending triangles break to the upside 70% of the time. A bullish breakthrough of this sort would take us through the critical resistance level at $5.5k and potentially test the $6k resistance level. Keep in mind, these are some of the strongest support levels in Bitcoin history, therefore, breaking above them is not going to be easy for the bulls.
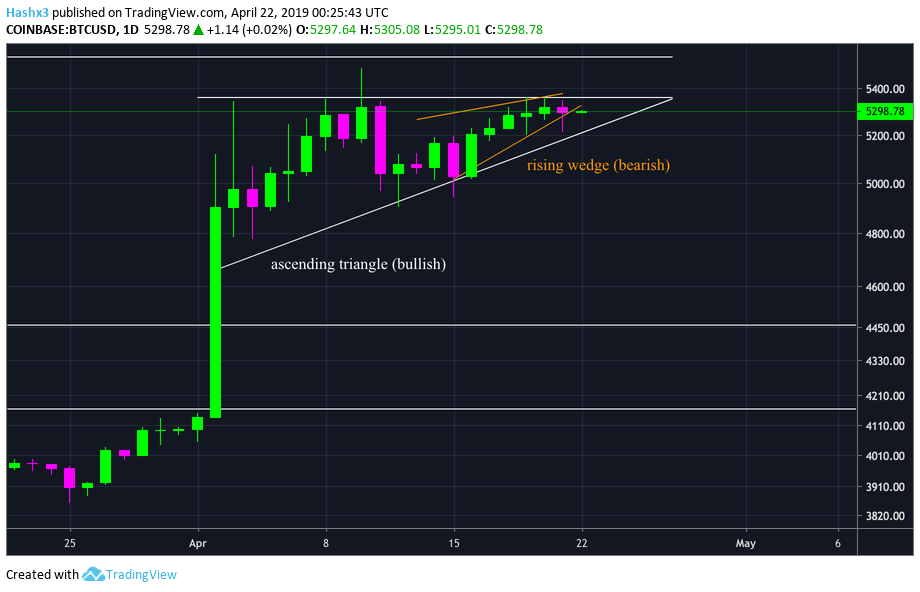
Currently, the bearish perspective is seeing Bitcoin’s gradual price increase as a classical rising wedge pattern (orange located on the chart above). Rising wedge patterns are traditionally indicative of bearish continuations. Should this rising wedge fall, price still has a support level from the upward sloping trend line at roughly $5.2k, however, if this support is broken Bitcoin could drop sharply and form a bart pattern at a price of roughly $4.6k.
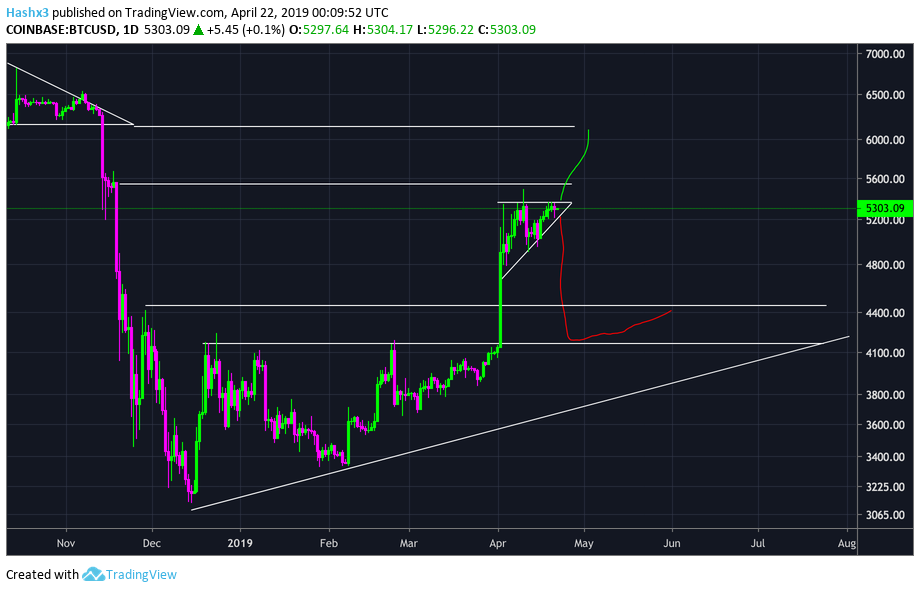
The chart above outlines possible price movements in both bearish and bullish scenarios.
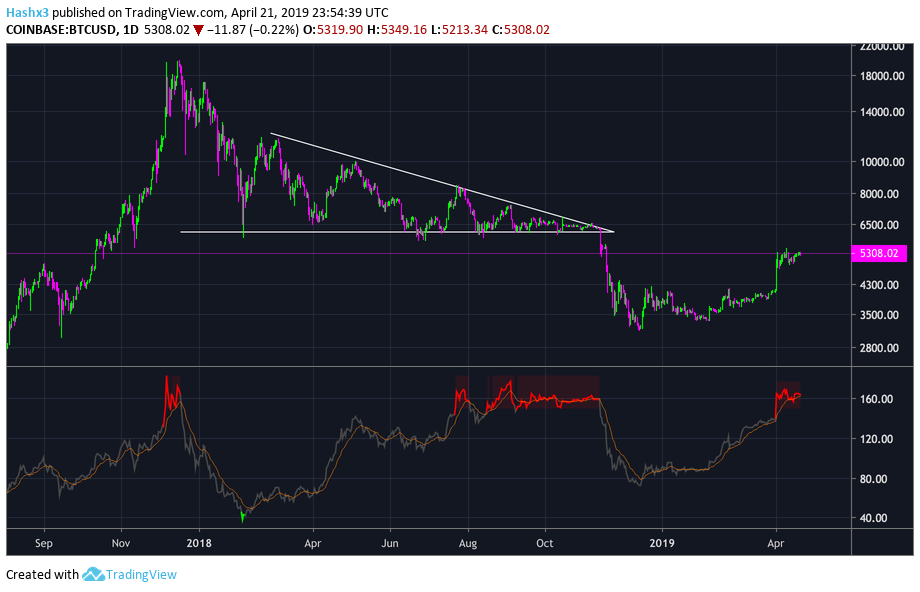
The chart above features the NVT indicator (Network Value to Transactions Ratio), prominently used by Bitcoin trader Willy Woo. NVT ratio is calculated by dividing network value (market cap) by the daily USD volume transmitted through the Bitcoin blockchain. A high NVT ratio tells us that Bitcoin’s value is overpriced relative to the value being transmitted on the payment network. This typically occurs when investors become excited after a significant price increase. It can also indicate the peak of an unsustainable bubble. Above all, a high NVT tells you that the trend is overbought. As you can see on the chart above, each time Bitcoin’s NVT ratio has peaked at 160, a substantial price drop has immediately followed.
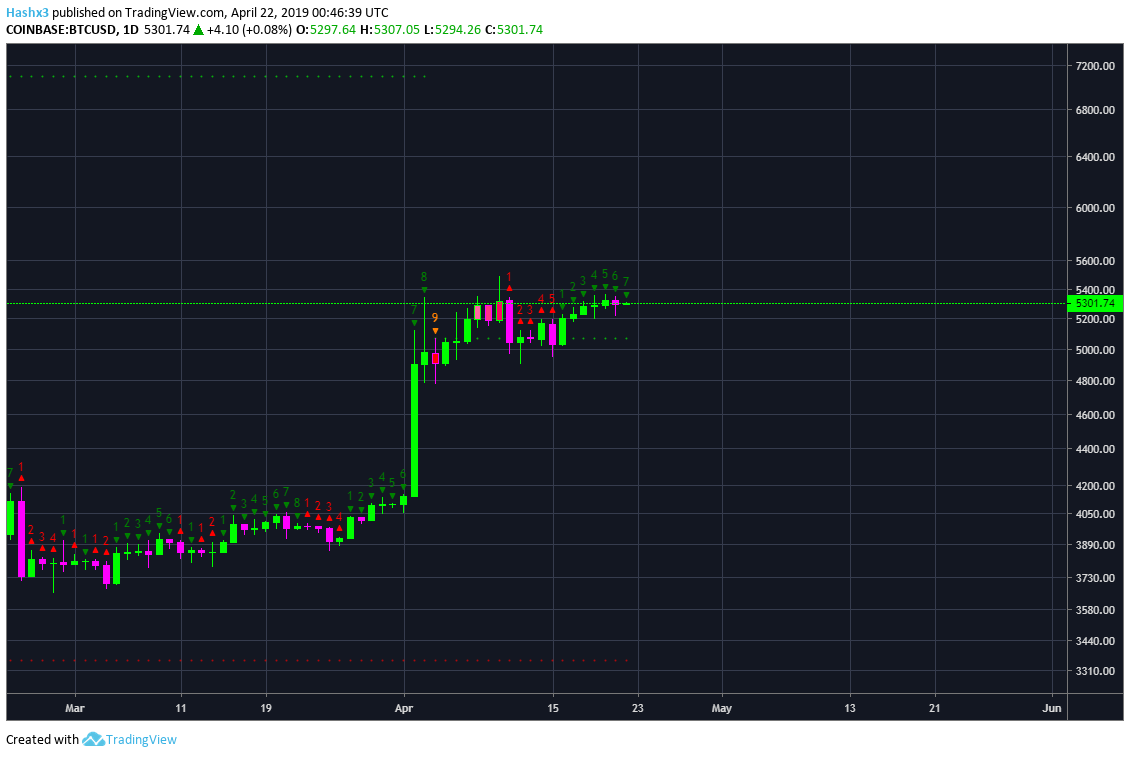
Additionally, the daily sequential indicator above is setting up to reach a green 9 in the next two days. If we hit a 9 on the daily chart it could indicate the beginning of a trend reversal as downward price action ensues.
Conclusion:
While there are some conflicting indicators, the bears seem to have more technicals working in their favor. Fortunately for the bulls, a temporary pullback of 20% isn’t going to create a new yearly low, in fact, it would be somewhat healthy for the bullish macro trend. Furthermore, creating a true higher low would present additional evidence that a market bottom is already in.
Disclaimer: This is not financial advice. Please make objective decisions and do your own research. The author of the article owns Bitcoin.