
Cryptocurrency
Bitcoin Technical Analysis 8/30/18: Potential ‘Cup and Handle’ Pattern Forming
After the recent run up experienced over the past two weeks, there has been an expected pullback from the strong resistance point of $7,200. This is expected to continue considering the Ichimoku Cloud indicator is signaling $7,100 – $7,200 is currently overbought territory. However, this potential pullback is not a negative sign, it is an […]

After the recent run up experienced over the past two weeks, there has been an expected pullback from the strong resistance point of $7,200. This is expected to continue considering the
Ichimoku Cloud indicator is signaling $7,100 – $7,200 is currently overbought territory. However, this potential pullback is not a negative sign, it is an indicator that bitcoin may be forming a traditional “cup and handle” pattern. Here’s what a traditional “cup and handle” pattern looks like:
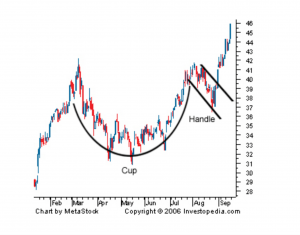
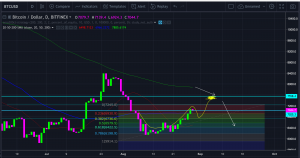
The bitcoin ‘cup’ was formed during the run up to $7,100. The ‘handle’ has been partially formed at 6,900 and will have to go lower to complete the handle. If a decline occurs the price is likely to bounce off of the support level at $6,700 – $6,800 which is also the 0.38 fibonacci retracement level. From here, it is possible to see a small run up as the cup and handle pattern increases back into the $7,200 – $7,500 range. Here, bitcoin will have the ability to forge a new lower high. This lower high is also in position to line up nicely with the 200 MA. Since there is strong resistance at $7,200 – $7,500, this zone may be an optimal area for traders to take profit.
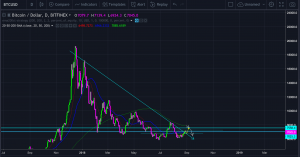
As many bitcoin bulls want to go straight to the moon, so far this conception has been very unlikely. Above all, it is important to understand where the overall trend is going. We are still in an overall bearish trend and it seems as if it will continue into the near term future.
Since the beginning of the bear market, we have seen about 3-4 short term bull reactions and it is possible we will continue this pattern by forming another lower high followed by a decline to test the critical support level of $6,000. In addition, a potential decrease after the newly formed lower high could create an optimal buying opportunity. For now, bitcoin remains to trade in an uncertain range in which profits are very difficult to come by.
Sources:
Bitcoin Charts from tradingview.com
Cup and Handle chart by Meta Stock, available at https://www.investopedia.com/terms/c/cupandhandle.asp
Additional source: https://cryptoiq.co/
Disclaimer: I am not a financial advisor, this is not financial advice. Please do your own research and make objective decisions. This article is intended to educate readers on the potential short term bitcoin price action. The author of the article owns cryptocurrency.