
Cryptocurrency
Bitcoin’s Bullish Momentum Continues: $6.2k Incoming?
Bitcoin’s bullish momentum continues as price touched $5.9k this morning. Last week’s explosive price action has added evidence that a bottom is in. That being said, technical analysis is indicating a mild pullback is likely. However, it is never easy to determine how elated the cryptocurrency market will become in the midst of a bull […]
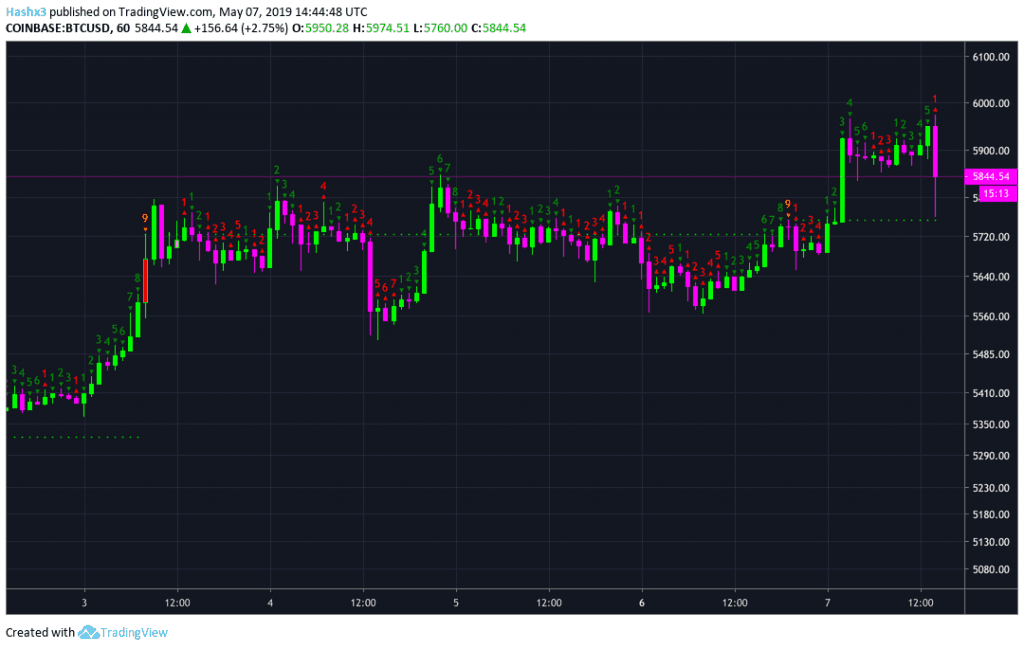
Bitcoin’s bullish momentum continues as price touched $5.9k this morning. Last week’s explosive price action has added evidence that a bottom is in. That being said, technical analysis is indicating a mild pullback is likely. However, it is never easy to determine how elated the cryptocurrency market will become in the midst of a bull run.
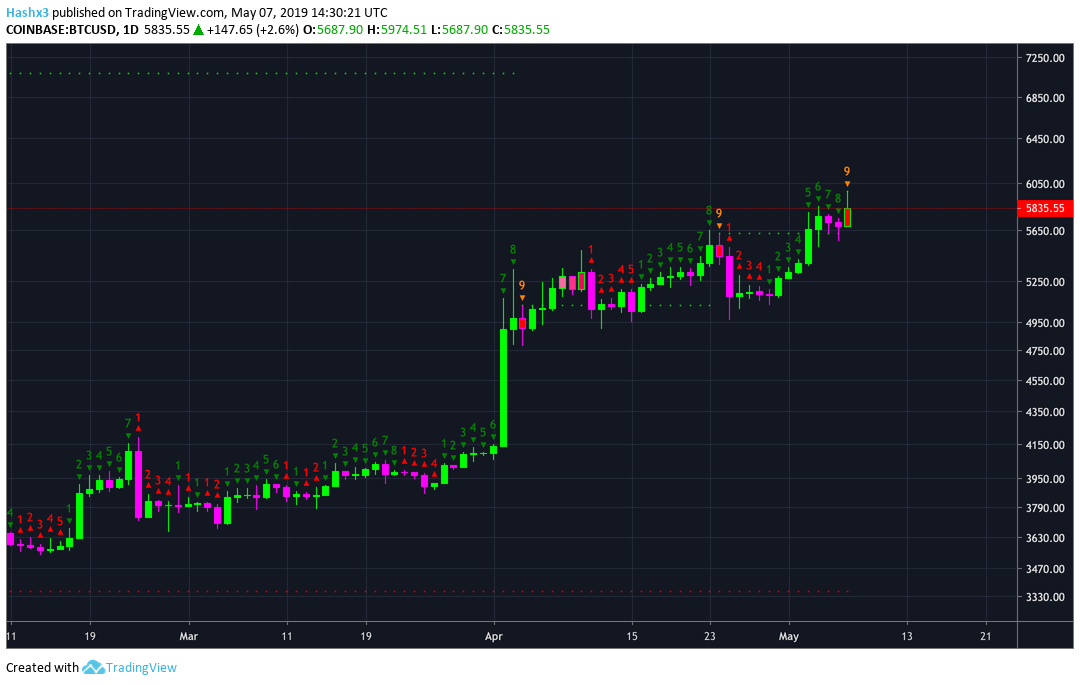
Daily Chart
While looking at the daily chart above, we can see that Bitcoin is currently on a green 9 candle. When the trend has enough momentum to reach a 9, a trend exhaustion or consolidation period is likely to follow. In fact, during the writing of this article Bitcoin’s price fell from $5,950 to $5,833, which may mean the pullback has already started. A trend exhaustion does not imply Bitcoin will reverse and fall below prior support channels. Rather, it is more likely a consolidation phase will occur soon. Additionally, the $6k price channel is the strongest resistance level in Bitcoin’s history, therefore, breaking above this level will likely take multiple attempts before price can rally above it.
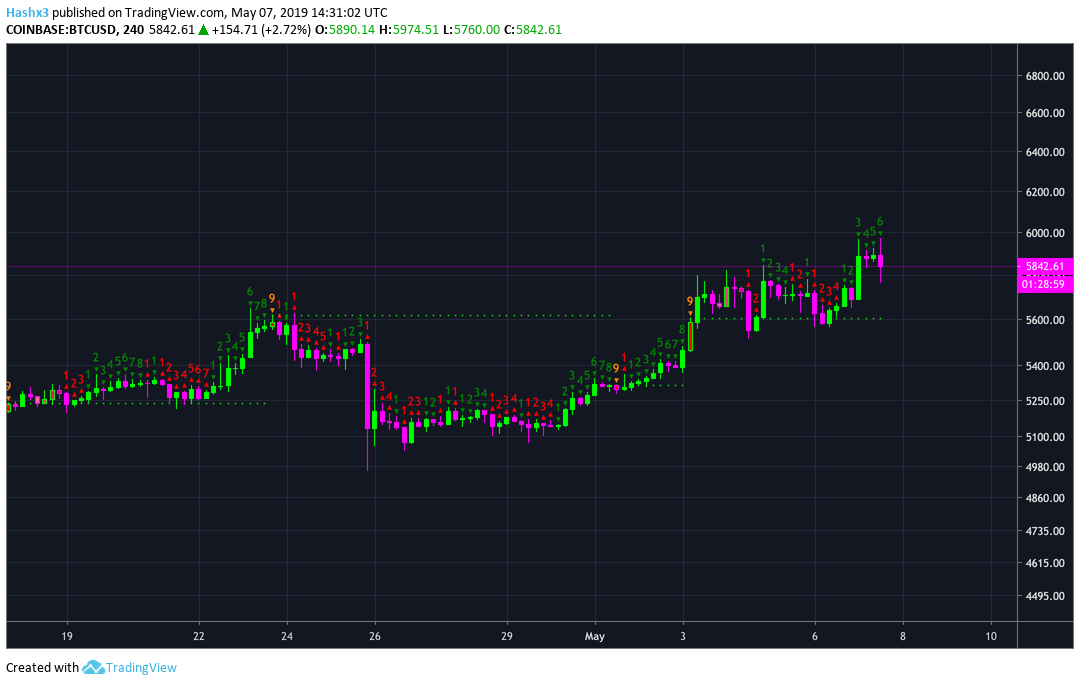
4hr Chart
Looking at the 4hr chart above, we can see that Bitcoin is at a green 6 of 9 candle. A green 6 tells us that our current bullish momentum will likely last up to 12-15 more hours before a pullback or consolidation phase occurs. Overall, the Bitcoin chart is looking incredibly bullish as more investors seem to be getting on the bandwagon. In 2017, many institutional and retail buyers missed out on the massive gains. In turn, they will be watching Bitcoin’s price action closely to ensure they don’t miss out again.
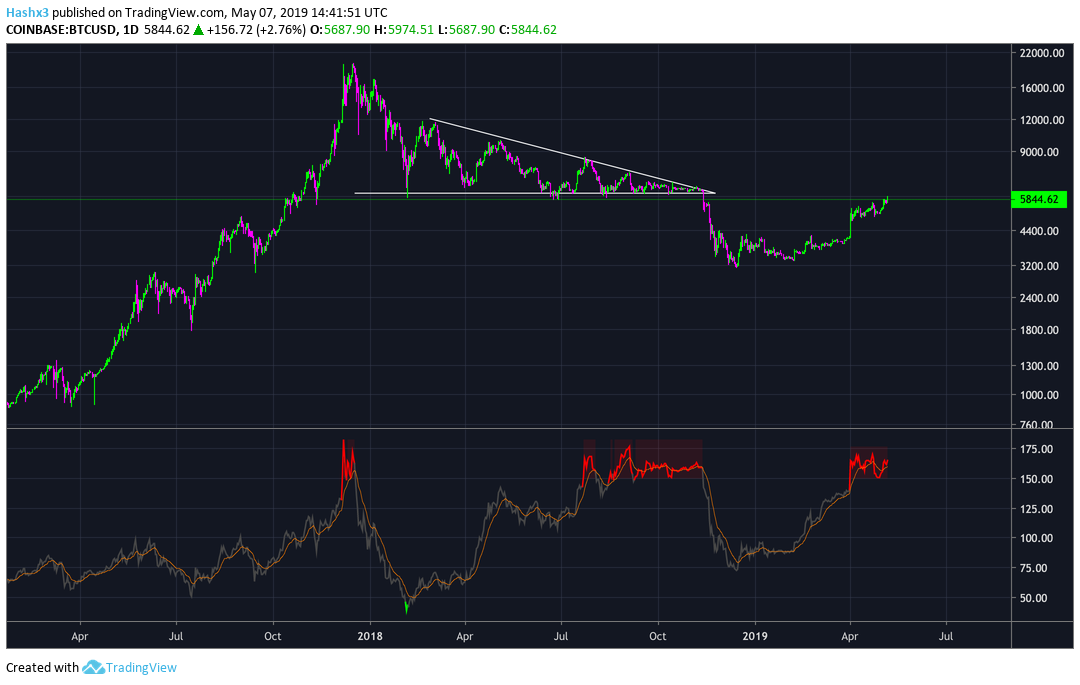
NVT
Above is the NVT (Network Value to Transactions) indicator which is still calling for bearish price action. This is surprising considering the NVT has been one of the most accurate indicators when calling historical bearish price action. Every time Bitcoin has reached the red zone in the NVT indicator, a large price drop has shortly followed. A high NVT ratio tells us that Bitcoin’s value is overpriced relative to the value being transmitted on the payment network. In a previous article we described how the NVT indicator is calculated.
Conclusion:
While Bitcoin’s bullish momentum continues, expect a mild pullback or consolidation phase before the $6k resistance level is purged. Breaking above $6k would be an incredible accomplishment for the bulls and would only add positive sentiment to the market.
Disclaimer: I am not a financial advisor, nothing in this article should be considered financial advice. Please do your own research and make objective decisions. The author of the article owns Bitcoin.