
Cryptocurrency
Bitcoin’s Neutral Price Action Looks to Make an Explosive Move
From a weekly-macro perspective, the chart above shows that Bitcoin may be entering an ascending triangle formation. This formation is typically characteristic of a bullish continuation pattern. If this price action were to occur, our measured move would take us directly to $5.2k, which is a historic resistance level which was formed after price broke […]
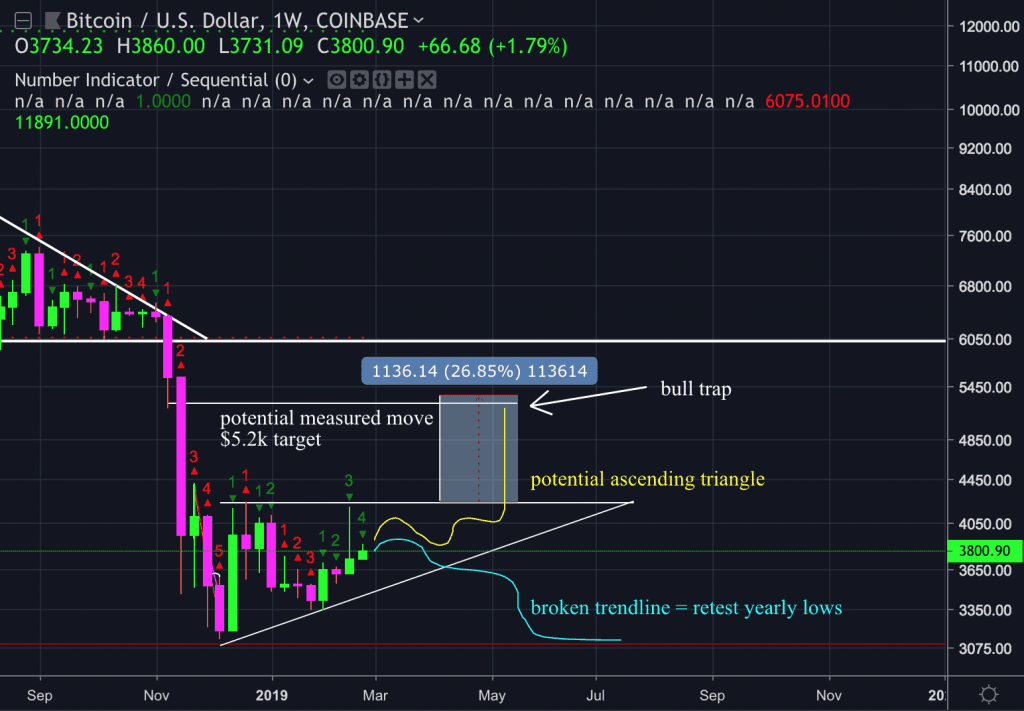
From a weekly-macro perspective, the chart above shows that Bitcoin may be entering an ascending triangle formation. This formation is typically characteristic of a bullish continuation pattern. If this price action were to occur, our measured move would take us directly to $5.2k, which is a historic resistance level which was formed after price broke below $6k in early November. As the chart displays above, this is a 26% price channel.
During phase 1 of the bear market (Jan 2018 – Nov 2018), Bitcoin tested support at $6k roughly six times. This was the strongest support level in Bitcoin’s history and for this reason, it may become the strongest resistance level in Bitcoin’s history. As a result, it is probable that a bull trap will occur anywhere from $5.2k – $6k.
The weekly chart above also displays the TD sequential indicator is currently at a ‘4’ on the weekly. Therefore, the price is still technically bullish according to the indicator. If our current upward sloping trend line is broken, then there will likely be a retest of yearly lows at roughly $3k.
There is no guarantee this price action will occur, but as a trader, it is essential to have a plan for multiple outcomes.
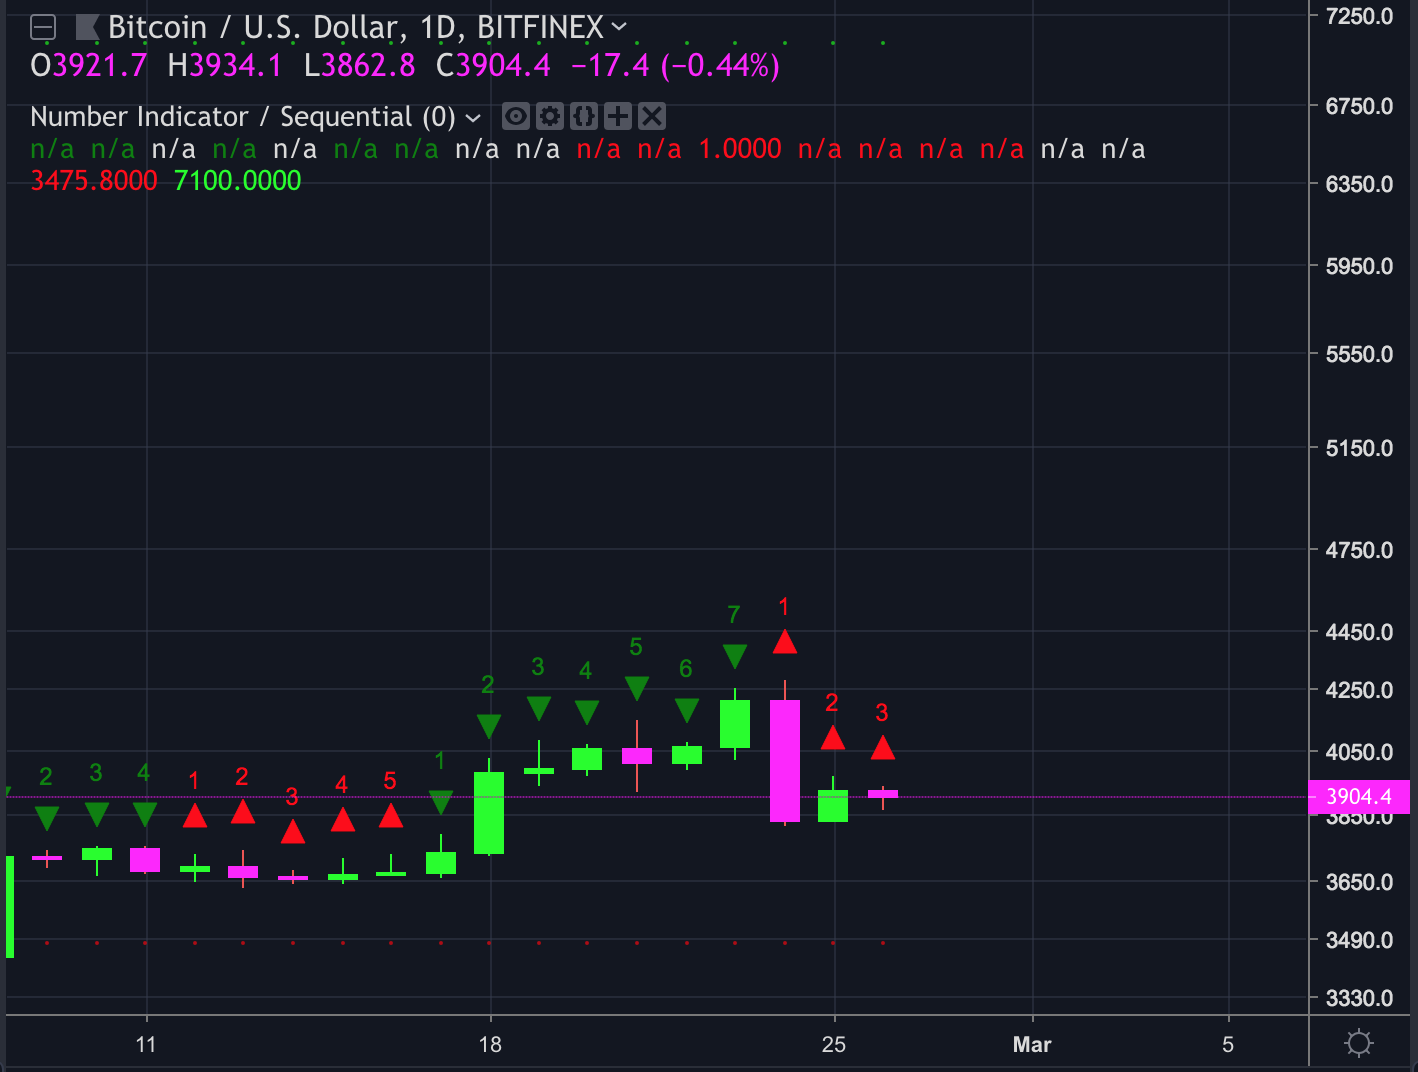
When viewing the TD sequential indicator below, the price is on a red count, however, the daily chart is still neutral. The most recent red ‘2’ candle did not go below the previous red ‘1’ candle, and the most-recent red ‘3’ has not gone below the previous ‘2’. Therefore, price action remains neutral. If you want to learn more about how to use the TD sequential indicator click here.
In the altcoin market, Bitcoin is the rising tide that lifts all ships. Nevertheless, Ethereum has recently been an interesting cryptocurrency to watch, not only because its #2, but also because its price action has given us clues as to where Bitcoin might follow. Ethereum led the market into last week’s price surge. Bitcoin and many other cryptocurrencies were forming an ascending triangle formation and ETH was the first to break to the upside while Bitcoin increased to 4.1k shortly after. One could argue that ETH has recently been an index for the health of the collective altcoin market.
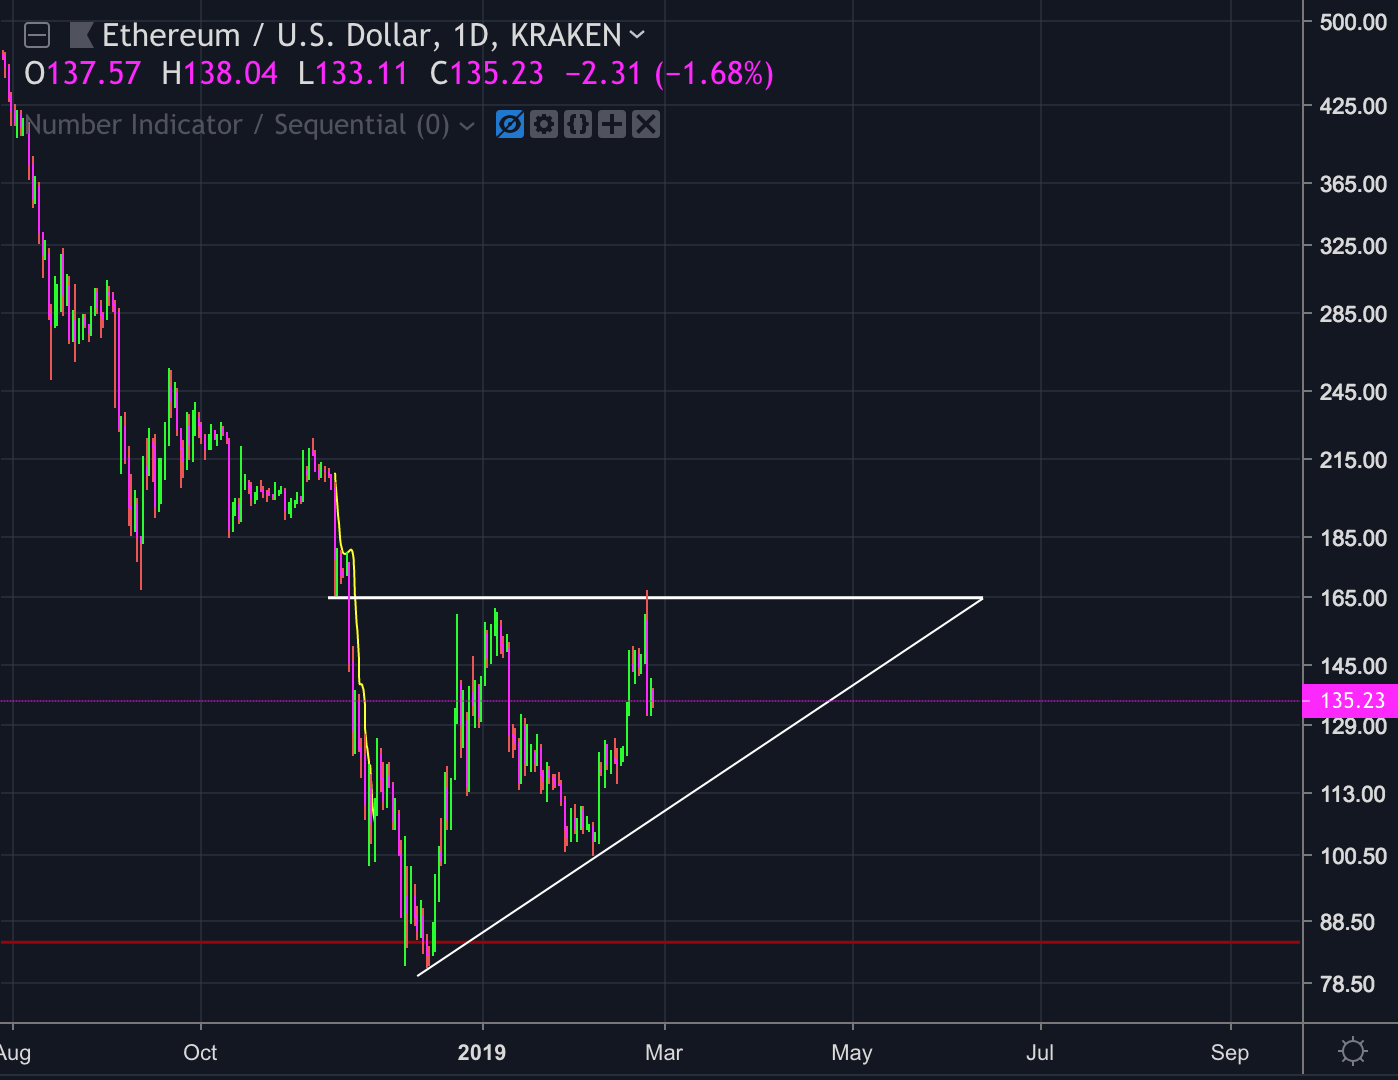
In the chart below, Ethereum is currently following the same ascending triangle that Bitcoin is in. Since they display similar chart characteristics, if one breaks to the upside, the other will likely follow shortly after. If Ethereum breaks above the ascending triangle it is currently in, the measured move would give us a target of roughly $200. If the bears break below the ascending trend line, price will likely make a tentative double-bottom at roughly $85.
Disclaimer: Charts are from tradingview.com. I am not a financial advisor. This is not financial advice. Please do your research independently and make objective decisions. This article is intended to educate readers on the recent state of the cryptocurrency market. The author of the article owns bitcoin.