
Cryptocurrency
Bitcoin’s Run Continues as Crypto Greed Index Increases
Daily Bitcoin’s run continues as the market becomes more optimistic. When looking at the daily chart above, the sequential indicator is currently on a green 3 coming after a green 9 earlier this week. Yesterday, the sequential indicator closed on a green 2 going above a green 1, closing above a previous green 9. Typically, […]
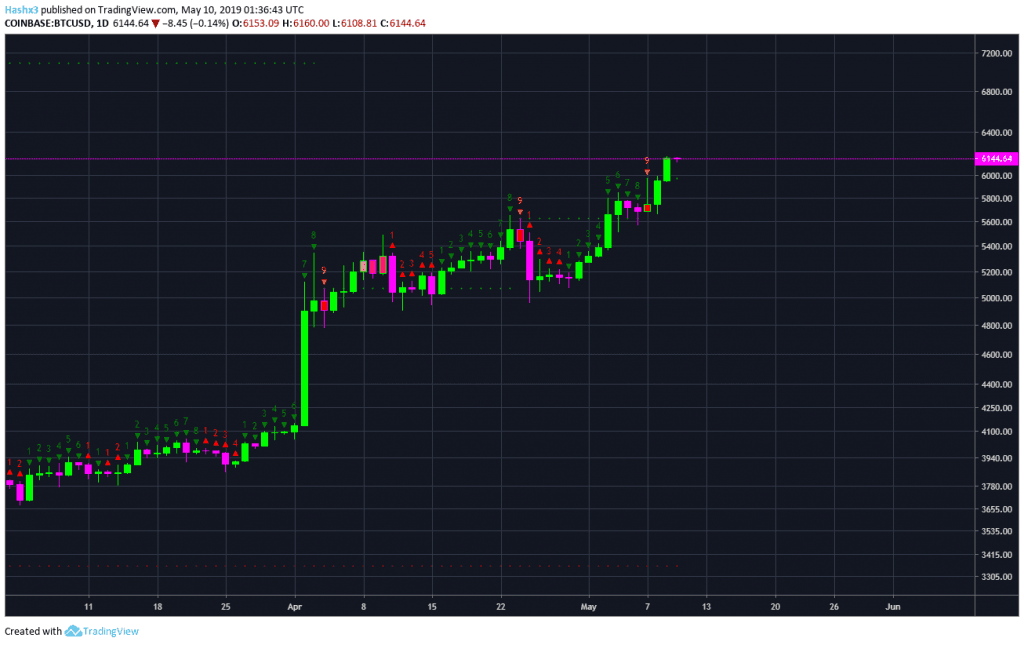
Daily
Bitcoin’s run continues as the market becomes more optimistic. When looking at the daily chart above, the sequential indicator is currently on a green 3 coming after a green 9 earlier this week. Yesterday, the sequential indicator closed on a green 2 going above a green 1, closing above a previous green 9. Typically, this is a very bullish trade signal. Therefore, momentum is likely to continue upward for the next few days. However, an eventual pullback to the $4k or $5k price channel would be healthy for the market. It would present an ideal opportunity to buy the dip. Also, Bitcoin would then make a true higher low. Nevertheless, the sequential indicator remains bullish through the week.
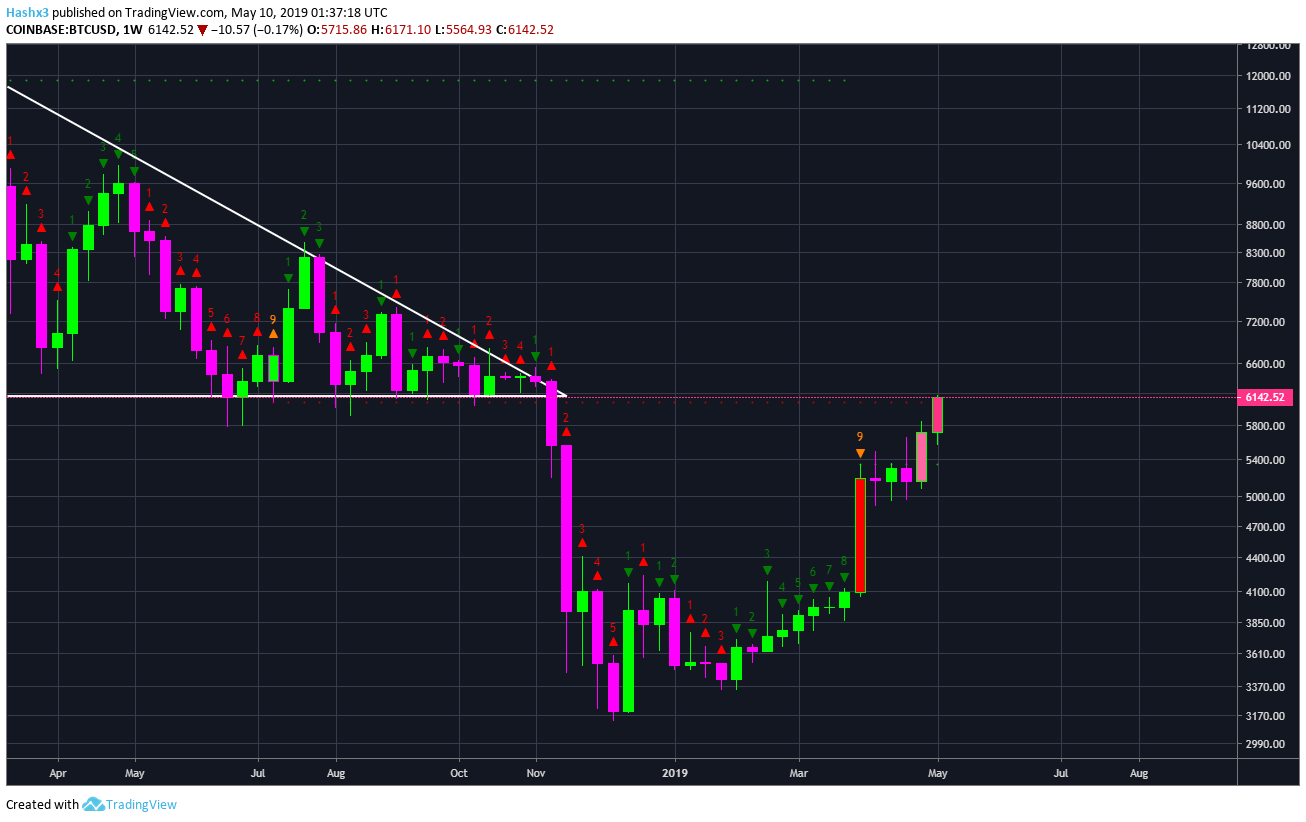
Weekly
The weekly chart above is bullish as well. The sequential indicator is currently at a green 5 going above a green 4. The combination of the weekly and daily sequential indicators can be interpreted as a bullish trade setup. That being said, Bitcoin has increased 10% this week and some indicators are leaning bearish. For example, the crypto Fear and Greed Index is currently at 69. This is the highest level since early April.
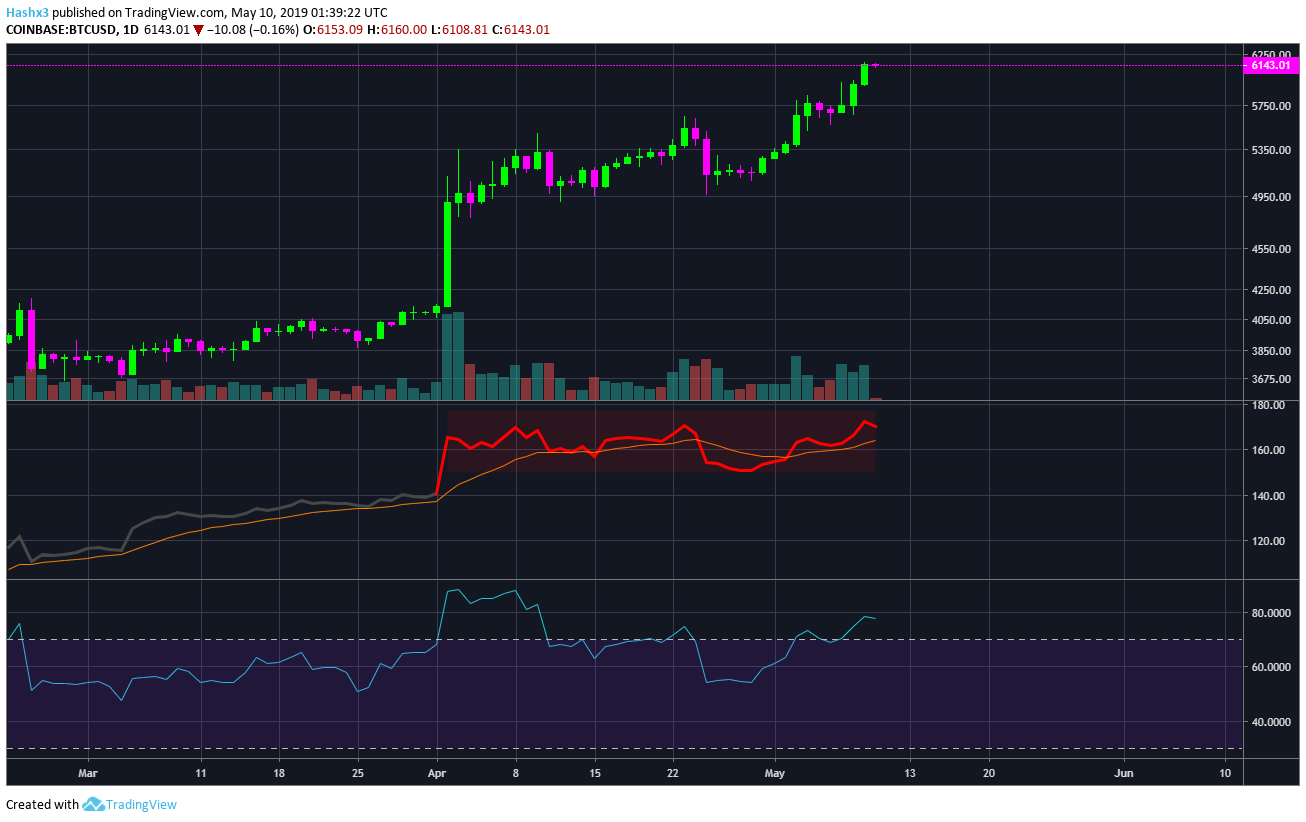
Daily RSI & NVT
The chart above displays the NVT (Network Value to Transactions) ratio as well as daily RSI. Bitcoin still has a very high NVT ratio which has historically been a bearish indicator. Every time the NVT ratio has entered the red zone a substantial price decrease has followed. Additionally, Bitcoin’s RSI (relative strength index) is still in overbought territory.
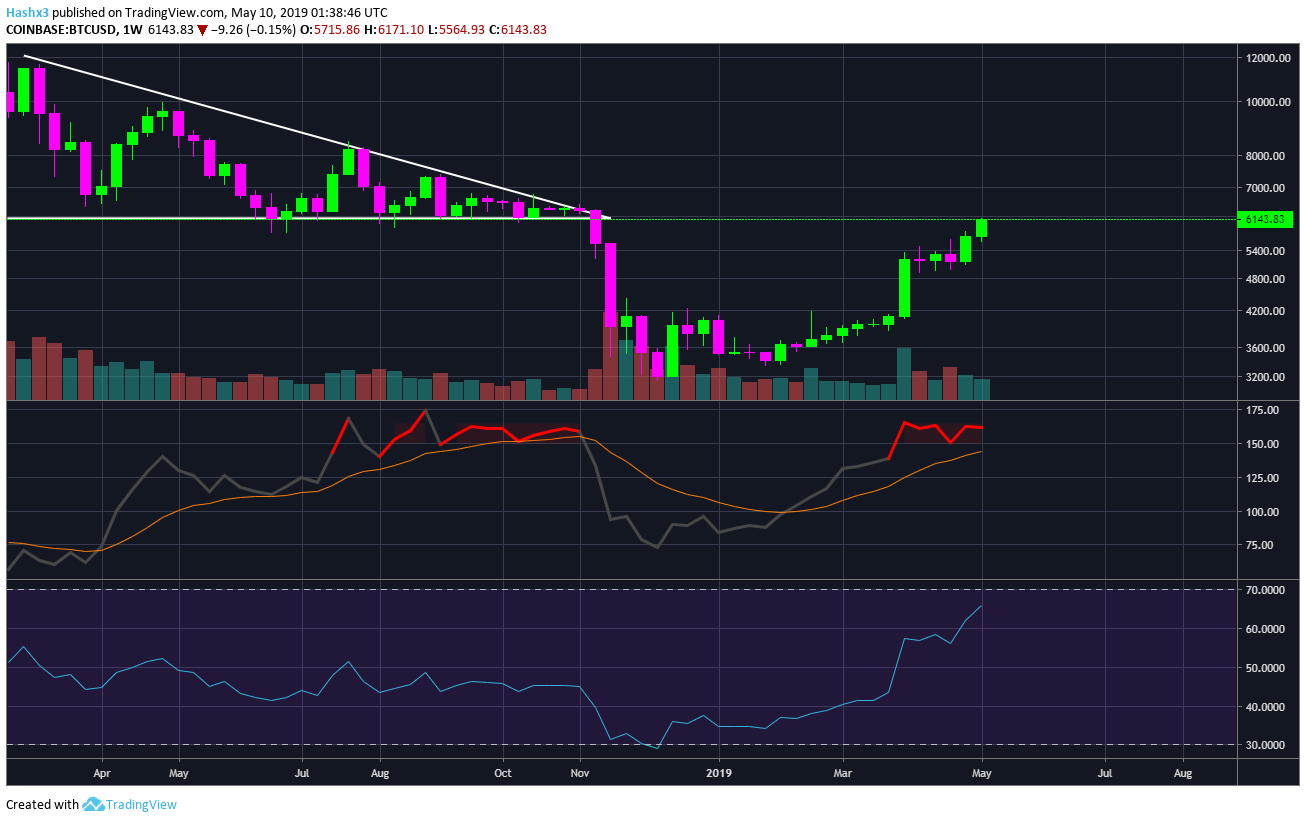
Weekly RSI & NVT
Once again, the NVT ratio is in the red zone. Conversely, the weekly RSI is not in overbought territory yet. It appears RSI will enter overbought territory if Bitcoin’s price increases to $6.3k. A price of $6.3k would be a strong move for the bulls. If the bulls can rise above $6.3k and consolidate, price will have a strong support level established at $6k.
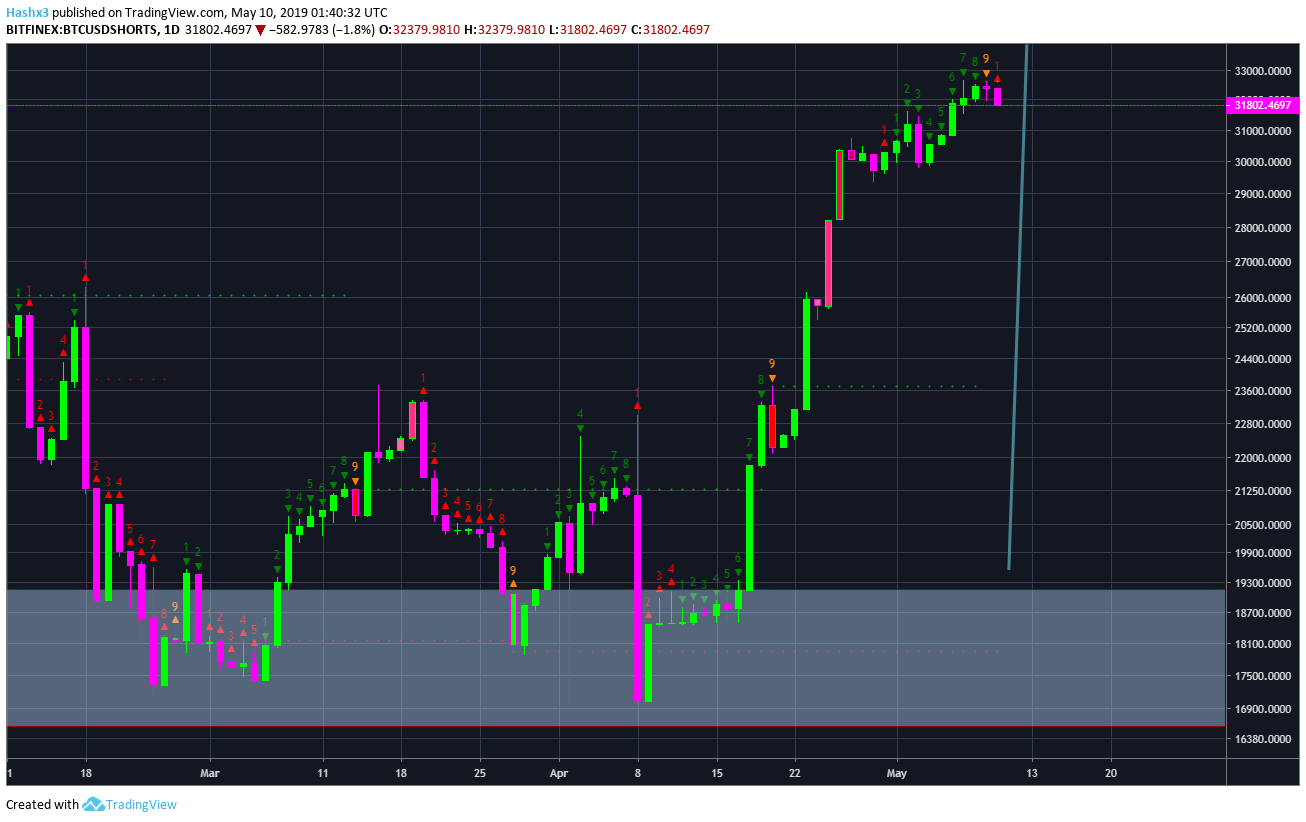
Shorts
Currently, Bitcoin shorts have been decreasing after topping on a green 9. Shorts appear to be leaving the market as price continues to rise. The sequential indicator is leaning bearish for the current number of Bitcoin shorts in the market.
Conclusion
For now, Bitcoin’s run continues. If Bitcoin can break above $6.3k and form strong support at the $6.2k price channel, the bulls will be in a good place. If price cannot break above $6.3k an eventual pullback to the $4k – $5k price channel would be very healthy for the market. A situation such as this would establish a true higher low for Bitcoin to begin a 2019 bull market. Either way, long-term hodlers should look to continue accumulating regardless of a potential pullback.
Disclaimer: I am not a financial adviser. This is not financial advice. Please do your research independently and make objective decisions. The author of the article owns Bitcoin.