
Cryptocurrency
Crypto.IQ BTC Analysis July 17, 2018
Get this analysis of the Bitcoin daily chart delivered to your inbox every day with a subscription to Crypto.IQ. Find out more about the benefits of joining. BTC bulls show up in force today with volume and price range upon breaking resistance. Resistances After drawing our fibonacci retracement set we the .382 level lines up with […]
BTC bulls show up in force today with volume and price range upon breaking resistance.
Resistances
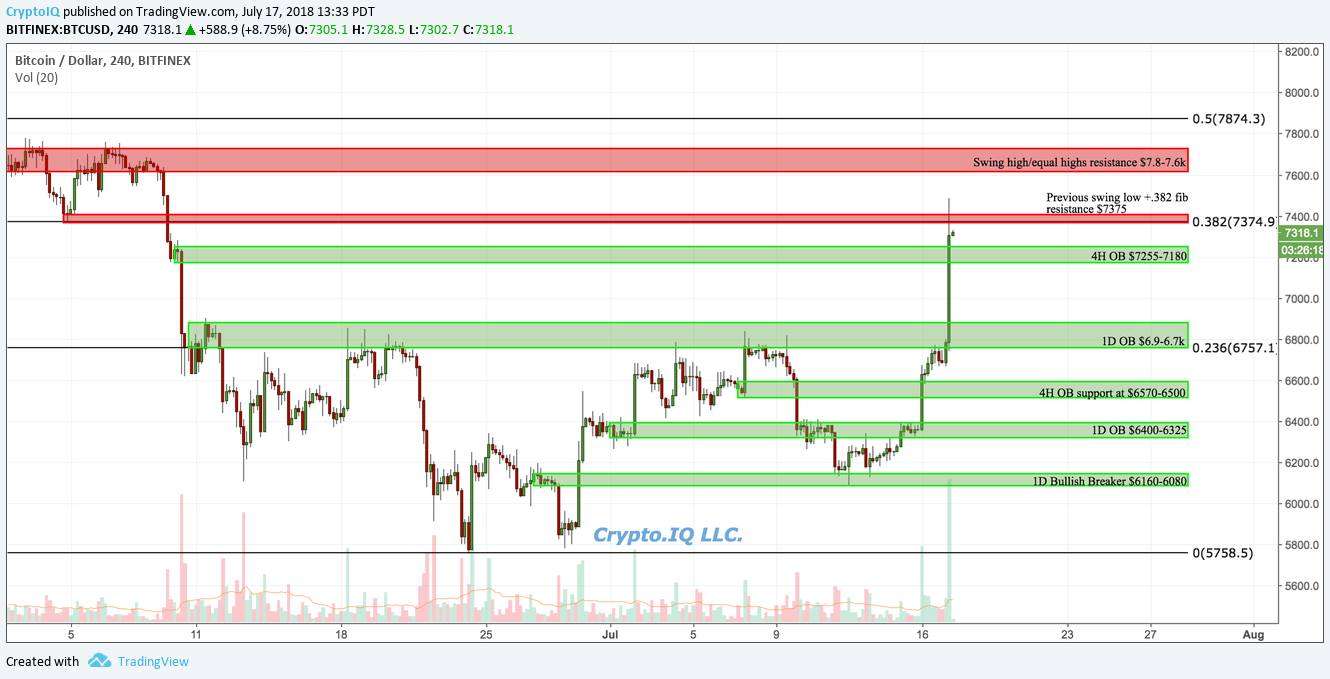
After drawing our fibonacci retracement set we the .382 level lines up with a previous swing low around $7375. This level looks to be just a hoop to jump through before the large resistance above.
$7.8-7.6k marks the previous resistance and equal highs level that sent price downwards with force during the last attempt at a rally. This level, like the one at $6.9k will cause a strong reaction to price if broken.
Supports
Resistance, when broken, turns into support. After the bullish move today we have a string of new support beneath price, the first being the 4H (now bullish) OB from $7225-7180.
Below that we have the previous wall of $6.9k that acted strongly as resistance before today. This will now act equally as strong as support and would make for a great spot to add to your short term BTC trading bag should the opportunity arise.
INDICATORS
Ichimoku Cloud
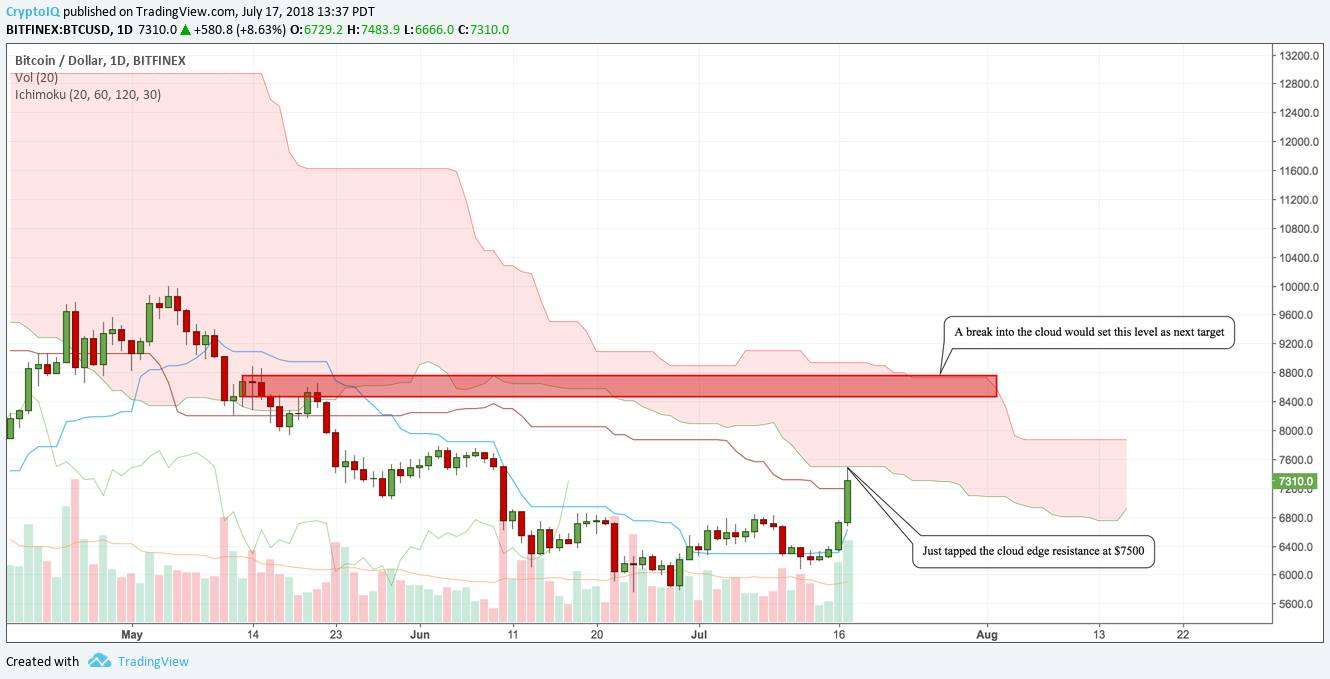
Almost to the dollar, the 1D cloud edge has stopped price in its tracks around $7.5k. A break into the daily cloud would signal a target at the opposite edge of the candle, of which would land around the $8.6k price range for the current setup. The lower time frame clouds continue to flip bullish, all the way up to the 4H.
Wyckoff Accumulation Chart
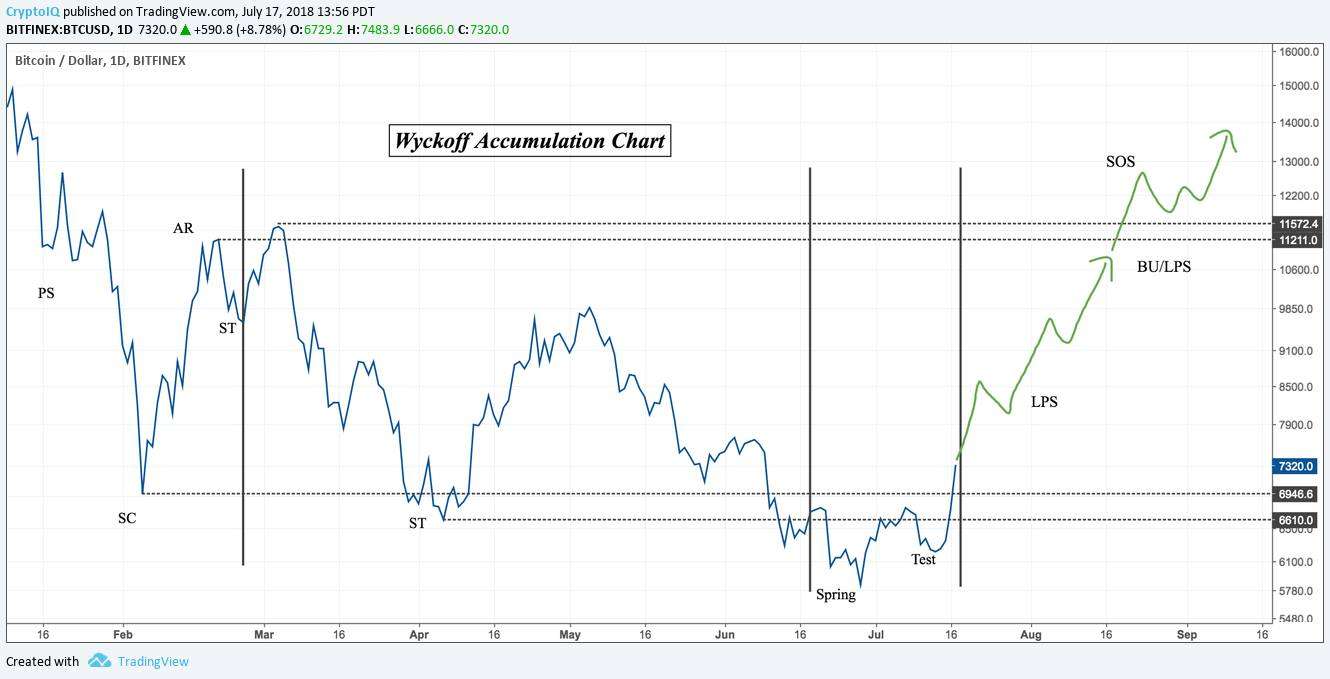
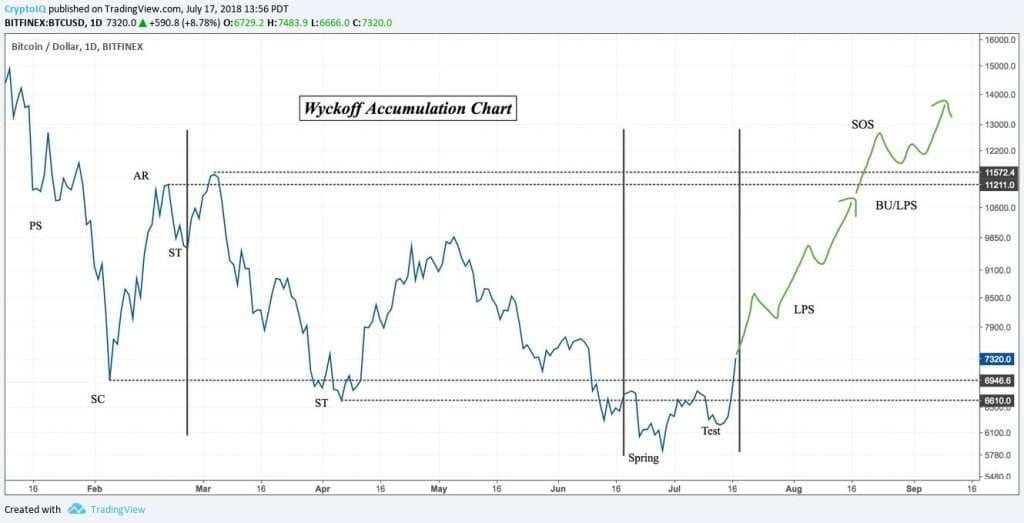
As stated weeks ago, the current setup looks like a textbook wyckoff accumulation model. This price action allows for larger players to accumulate in an optimal manner, and has seen repeated throughout every asset. The next step to further confirm this potential outcome would be to break above $7.8k and to enter “Phase D”, in which the last point of supply (LPS) would be gathered before the major breakout upwards.
CONCLUSION
Incredible display of strength from Bitcoin today as a bottom is put in, confirmed with the breakout above $6.9k.
The lower time frame trend indicators, like the Ichimoku cloud, are all flipping bullish, supporting current price action. We see the Wyckoff Model is continuing to play out almost identical to the schematic, leading us to believe continuation is very possible.
Until then, playing it level by level continues to be the best way to approach the current trading situation, with our eyes on $7.8-7.6k as the next pivotal point of action.