
Cryptocurrency
Crypto.IQ BTC Analysis June 16, 2018
Get this analysis of the Bitcoin daily chart delivered to your inbox every day with a subscription to Crypto.IQ. Find out more about the benefits of joining. Sideways action and choppy waters to start off the weekend. Resistances & Supports Resistances (same levels as yesterday) After breaking above the $6.4k resistance we now set our sights […]
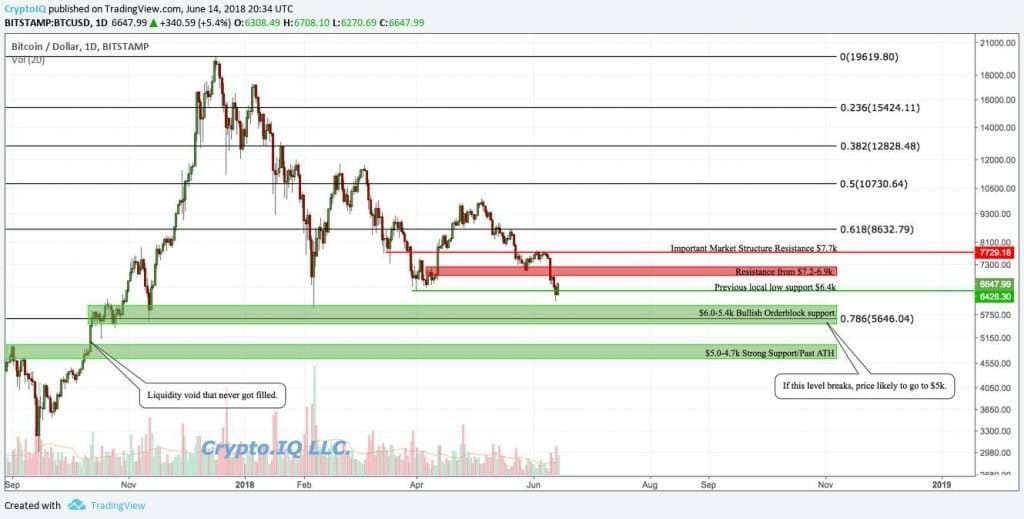
Sideways action and choppy waters to start off the weekend.
Resistances & Supports
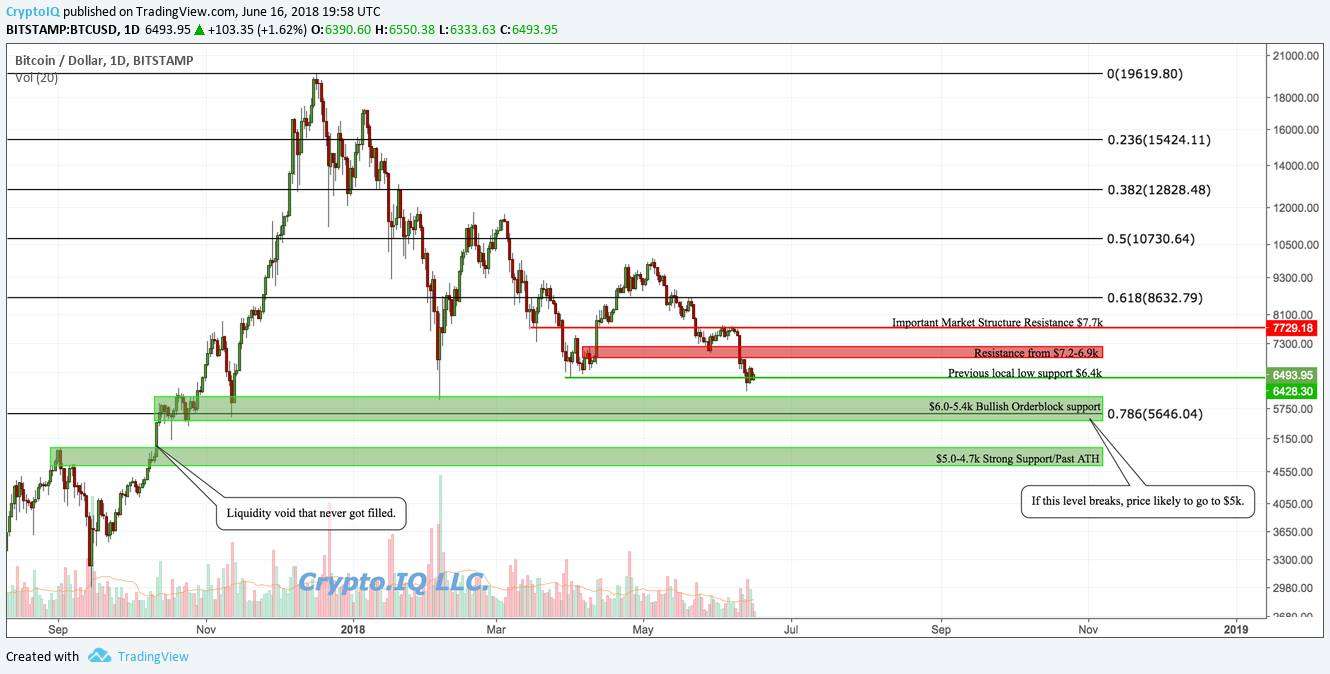
Resistances (same levels as yesterday)
After breaking above the $6.4k resistance we now set our sights on the previous swing low around $7.2-6.9k.
Above $7.2k we will look to break $7.7k and change the market structure in the mid term bullish.
Supports (same levels as yesterday)
The resistance at $6.4k now turns back into support, making this a zone we expect price to experience a bounce/reversal from if/when price retraces after this large move.
Below $6.4k remains the large bullish zone from $6k-5.4k.
Moving Averages
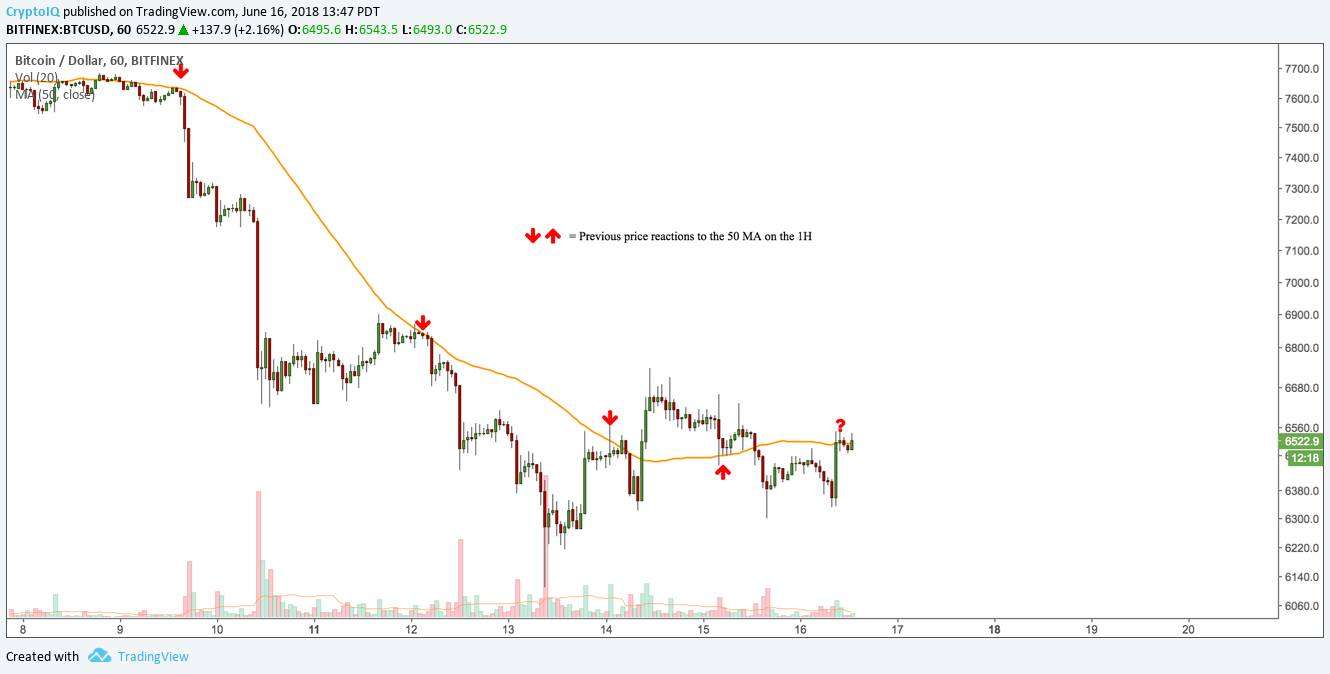
The 1H 50 Moving Average has provided several reactions to price in the recent past. At the moment price is hitting its head on this indicator, suggesting a potential resistance reaction could occur in the near future, sending price downwards.
Ichimoku Cloud
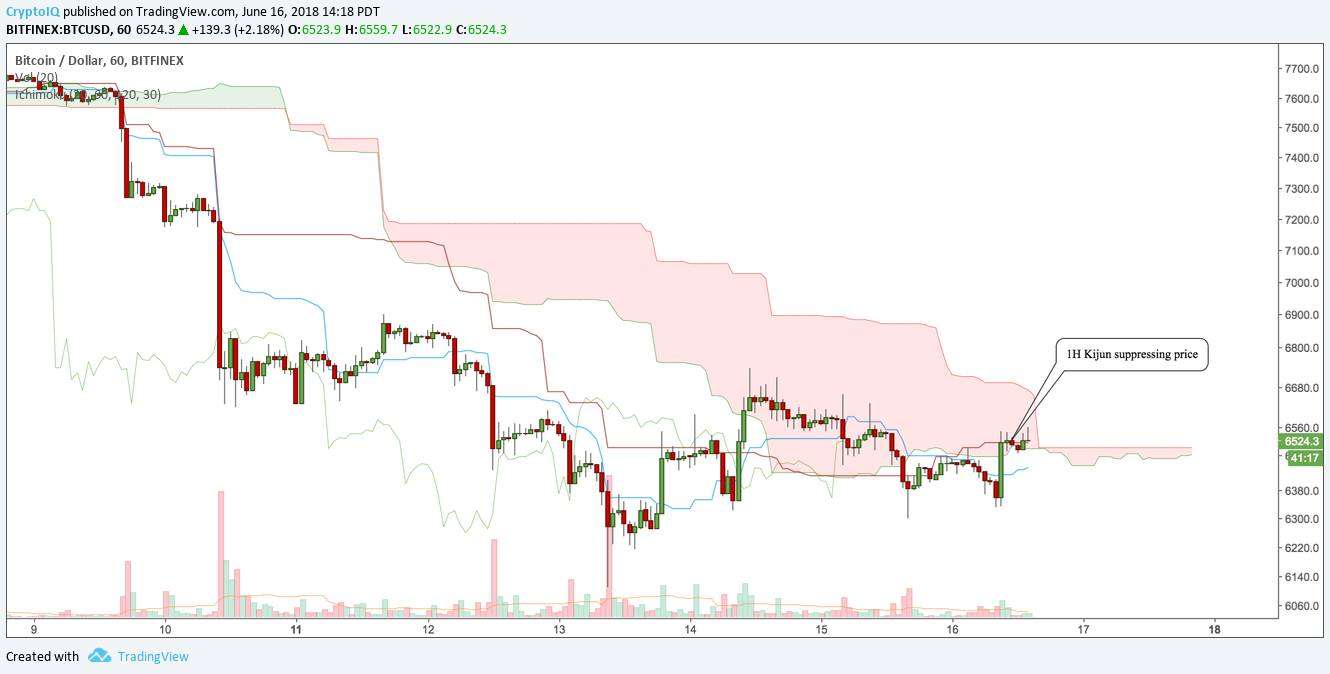
The 1H cloud indicator, the kijun (red line), similar to a moving average, is also lining up with a price rejection zone, similar to the 50 MA. A break above both of these would give some hope to the near sighted bulls.
2014 Bear Market Study
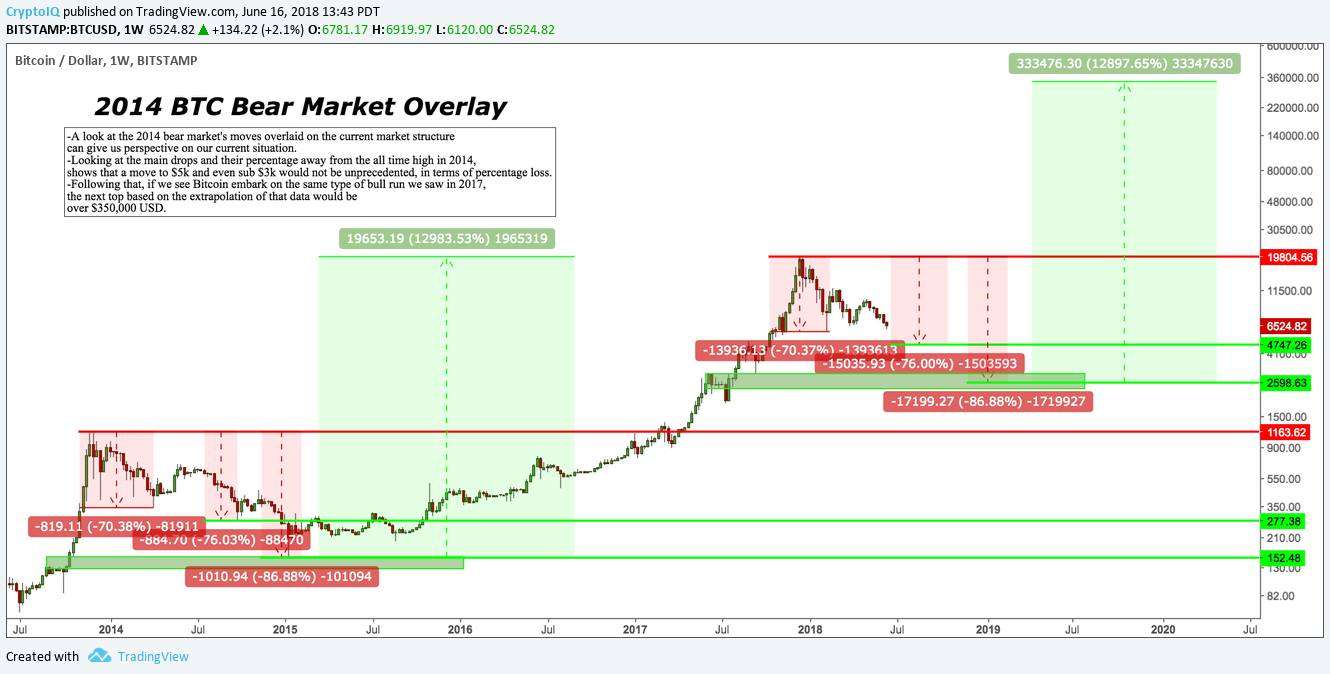
First and foremost, past performance is not indicative of future results. That said, history does tend to repeat itself.
Looking at the past cycles of Bitcoin we can gain a broader perspective on the current price action.
Extrapolating the percentage losses to important bounce zones in the 2014 market, and applying them to the current market structure, we see that the price levels of $5k and $3k would not be an unprecedented percentage move by Bitcoin.
With even less infrastructure and public adoption, one can imagine how the holders of the past must have felt during such a turbulent time.
Looking forward, you then see the rise of the 2016-2017 bull market, which saw an increase of nearly 13,000% from the bear market lows.
Should the current market fall to similar lows as it did in 2014 in terms of percentage, and then rise in a similar fashion, a top in the ballpark of $350,000 USD per Bitcoin would be a mirrored move of price action of the past.
Conclusion
It is easy to get tied up in near term projections and price action with something as exciting as Bitcoin. Zooming out and maintaining a patience and macro perspective has rewarded investors with more money than any other strategy.
In the event price is rejected by the indicators listed above and moves further down, which is by all means possible, do not fear, but instead, smile on the opportunity.
$6.9k remains the near term level to break above for a continued rally for the bulls, with the $6k support level looming below ready to provide a bounce.