
Cryptocurrency
Crypto.IQ BTC Analysis June 28, 2018
Get this analysis of the Bitcoin daily chart delivered to your inbox every day with a subscription to Crypto.IQ. Find out more about the benefits of joining. Sideways chop for the better part of the past 24 hours, volatility drying up. Resistances & Supports Resistances (same levels as yesterday) Zooming in to lower time frames due […]
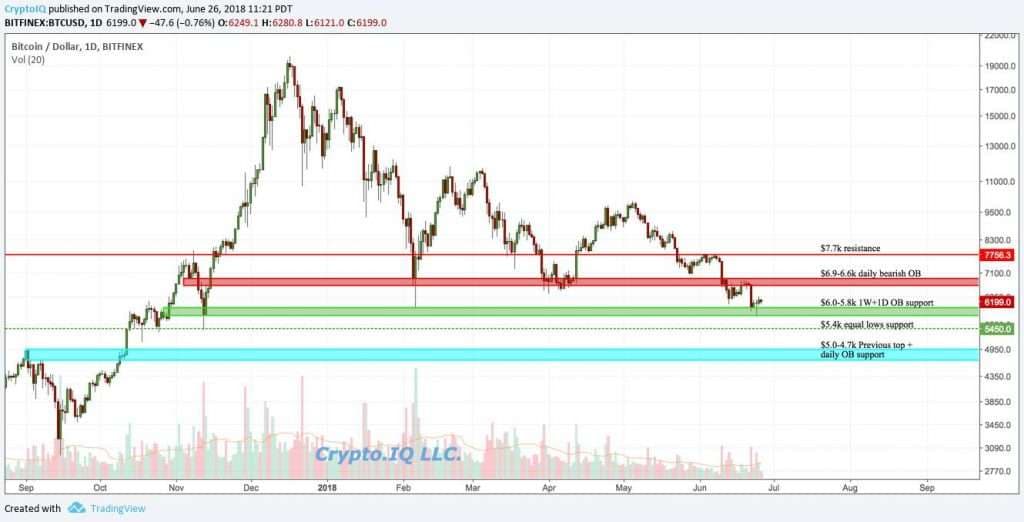
Sideways chop for the better part of the past 24 hours, volatility drying up.
Resistances & Supports
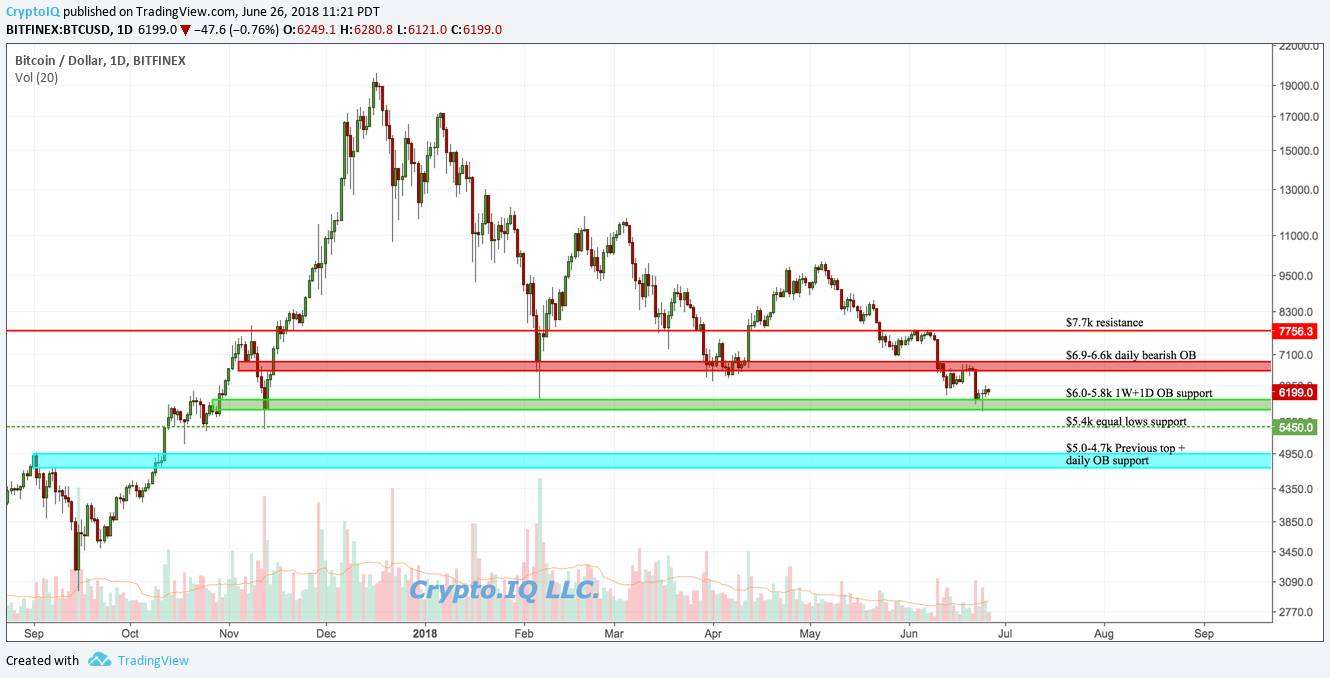
Resistances (same levels as yesterday)
Zooming in to lower time frames due to the drop in volatility recently, we see that the $6.9k level is still holding strong, backed by a confluence of indicators and previous price action.
Should price break above that, it will a see a bit of push back from the previous low/swing low at $7040-7100.
Above that is a bearish orderblock/resistance at $7.2k that larger short players will likely attempt to protect.
Supports (same levels as yesterday)
As price moves with gusto towards new lows, it seems likely we break below the February bottom at $6k. Overlapping multiple time frame levels highlights the support from $6k-5.8k, which will be a zone to set some bids in for a bounce as price tumbles down.
Should $5.8k fail to hold, there is a nice set of equal lows at the $5.4k mark which will act as support.
In the event price finds its way all the way down to the $5k level, buying in the long term support zone from $5-4.7k will be a good bet for at least a strong bounce.
Moving Averages
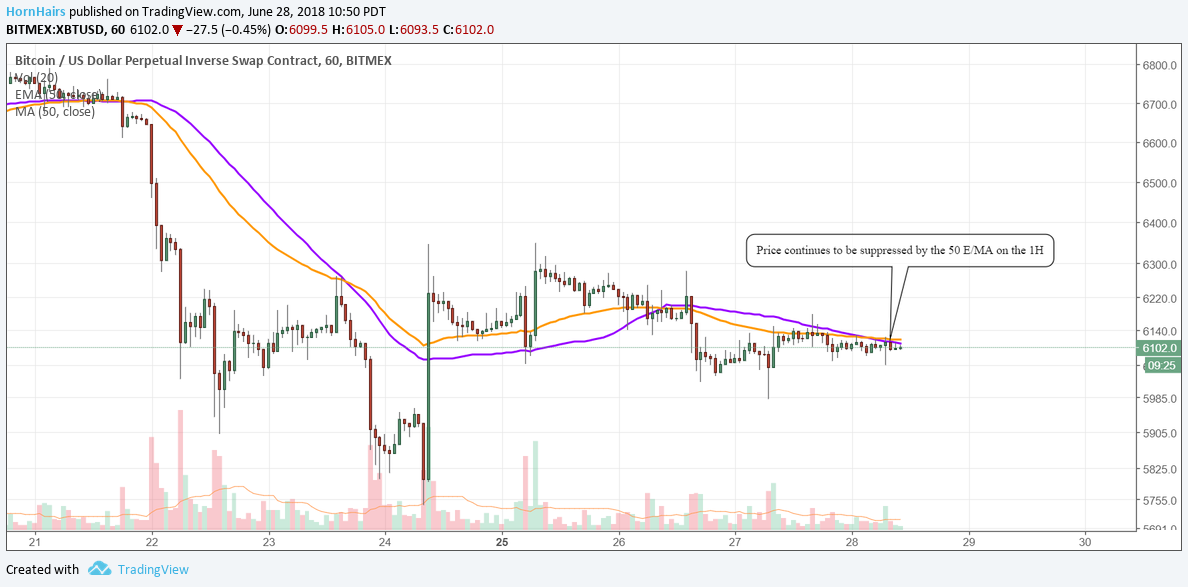 The 1H 50 MA continues to suppress price, acting as resistance as it hovers above price. A break above this would flip moving average traders bullish on lower time frames and be a good sign for the bulls. Price remains below important moving averages on higher time frames, as well.
Ichimoku Cloud
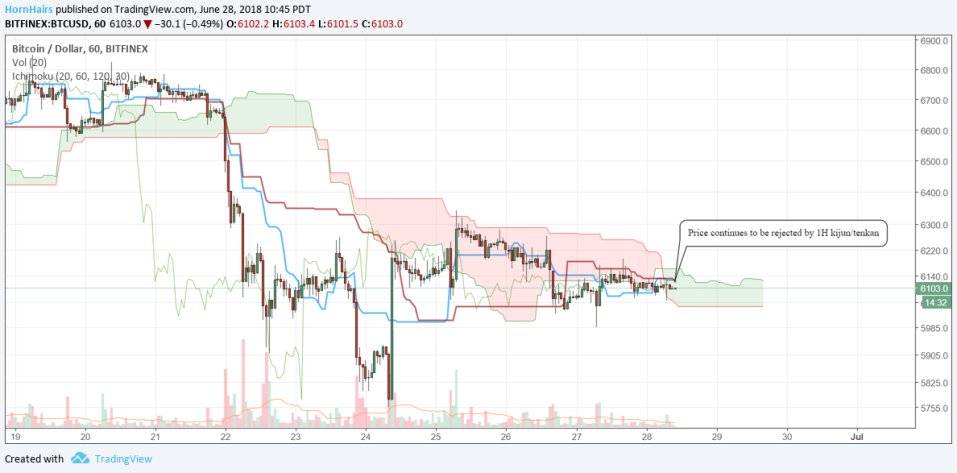 The 1H kijun, similar to the 50 MA on the 1H, is giving price a bit of resistance at the current level from $6.1-6.2k. A break above the kijun and above the cloud would signal a short term long entry for cloud traders. The 1H is not as reliable as the higher time frame ichimoku cloud, so keep that in mind. Price remains bearish under higher time frame cloud metrics.
Conclusion
The past few days have shown some of the choppiest price action in the recent past for Bitcoin. As bear markets come to an end, volatility begins to diminish.
After a few panic selling drops a bear market will chop sideways for a while, allowing larger players to accumulate the asset at a stable and lower price. This past week is a sample of what we can expect coming in to the end of the bear market.
A break above $6.4k would signify a higher high and open the doors up for a rally, whilst a break below the current low will likely send price down to the $5.4k support.