
Cryptocurrency
Ethereum Bearish Momentum to Continue?
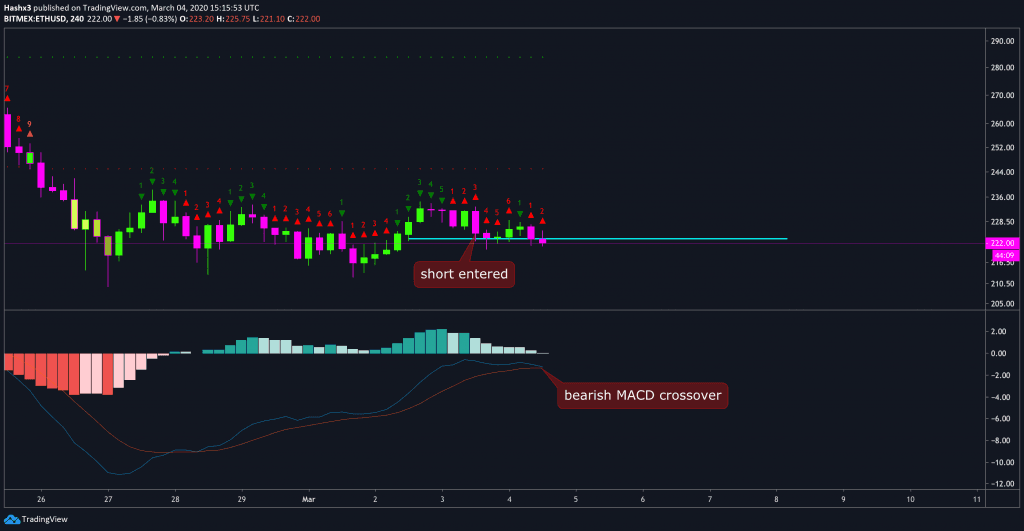
4 Hour On the 4 hour chart above, Ethereum has now reached a red 2 on the sequential indicator. A red 2 closing below a red 1 is an indication to place a short trade in sequential, however, this is not the only bearish indicator. In addition, Ethereum has just experienced a bearish crossover on […]
4 Hour
On the 4 hour chart above, Ethereum has now reached a red 2 on the sequential indicator. A red 2 closing below a red 1 is an indication to place a short trade in sequential, however, this is not the only bearish indicator. In addition, Ethereum has just experienced a bearish crossover on the MACD. As of now, indicators are telling us Ethereum is leaning bearish.
4 Hour Heikin Ashi
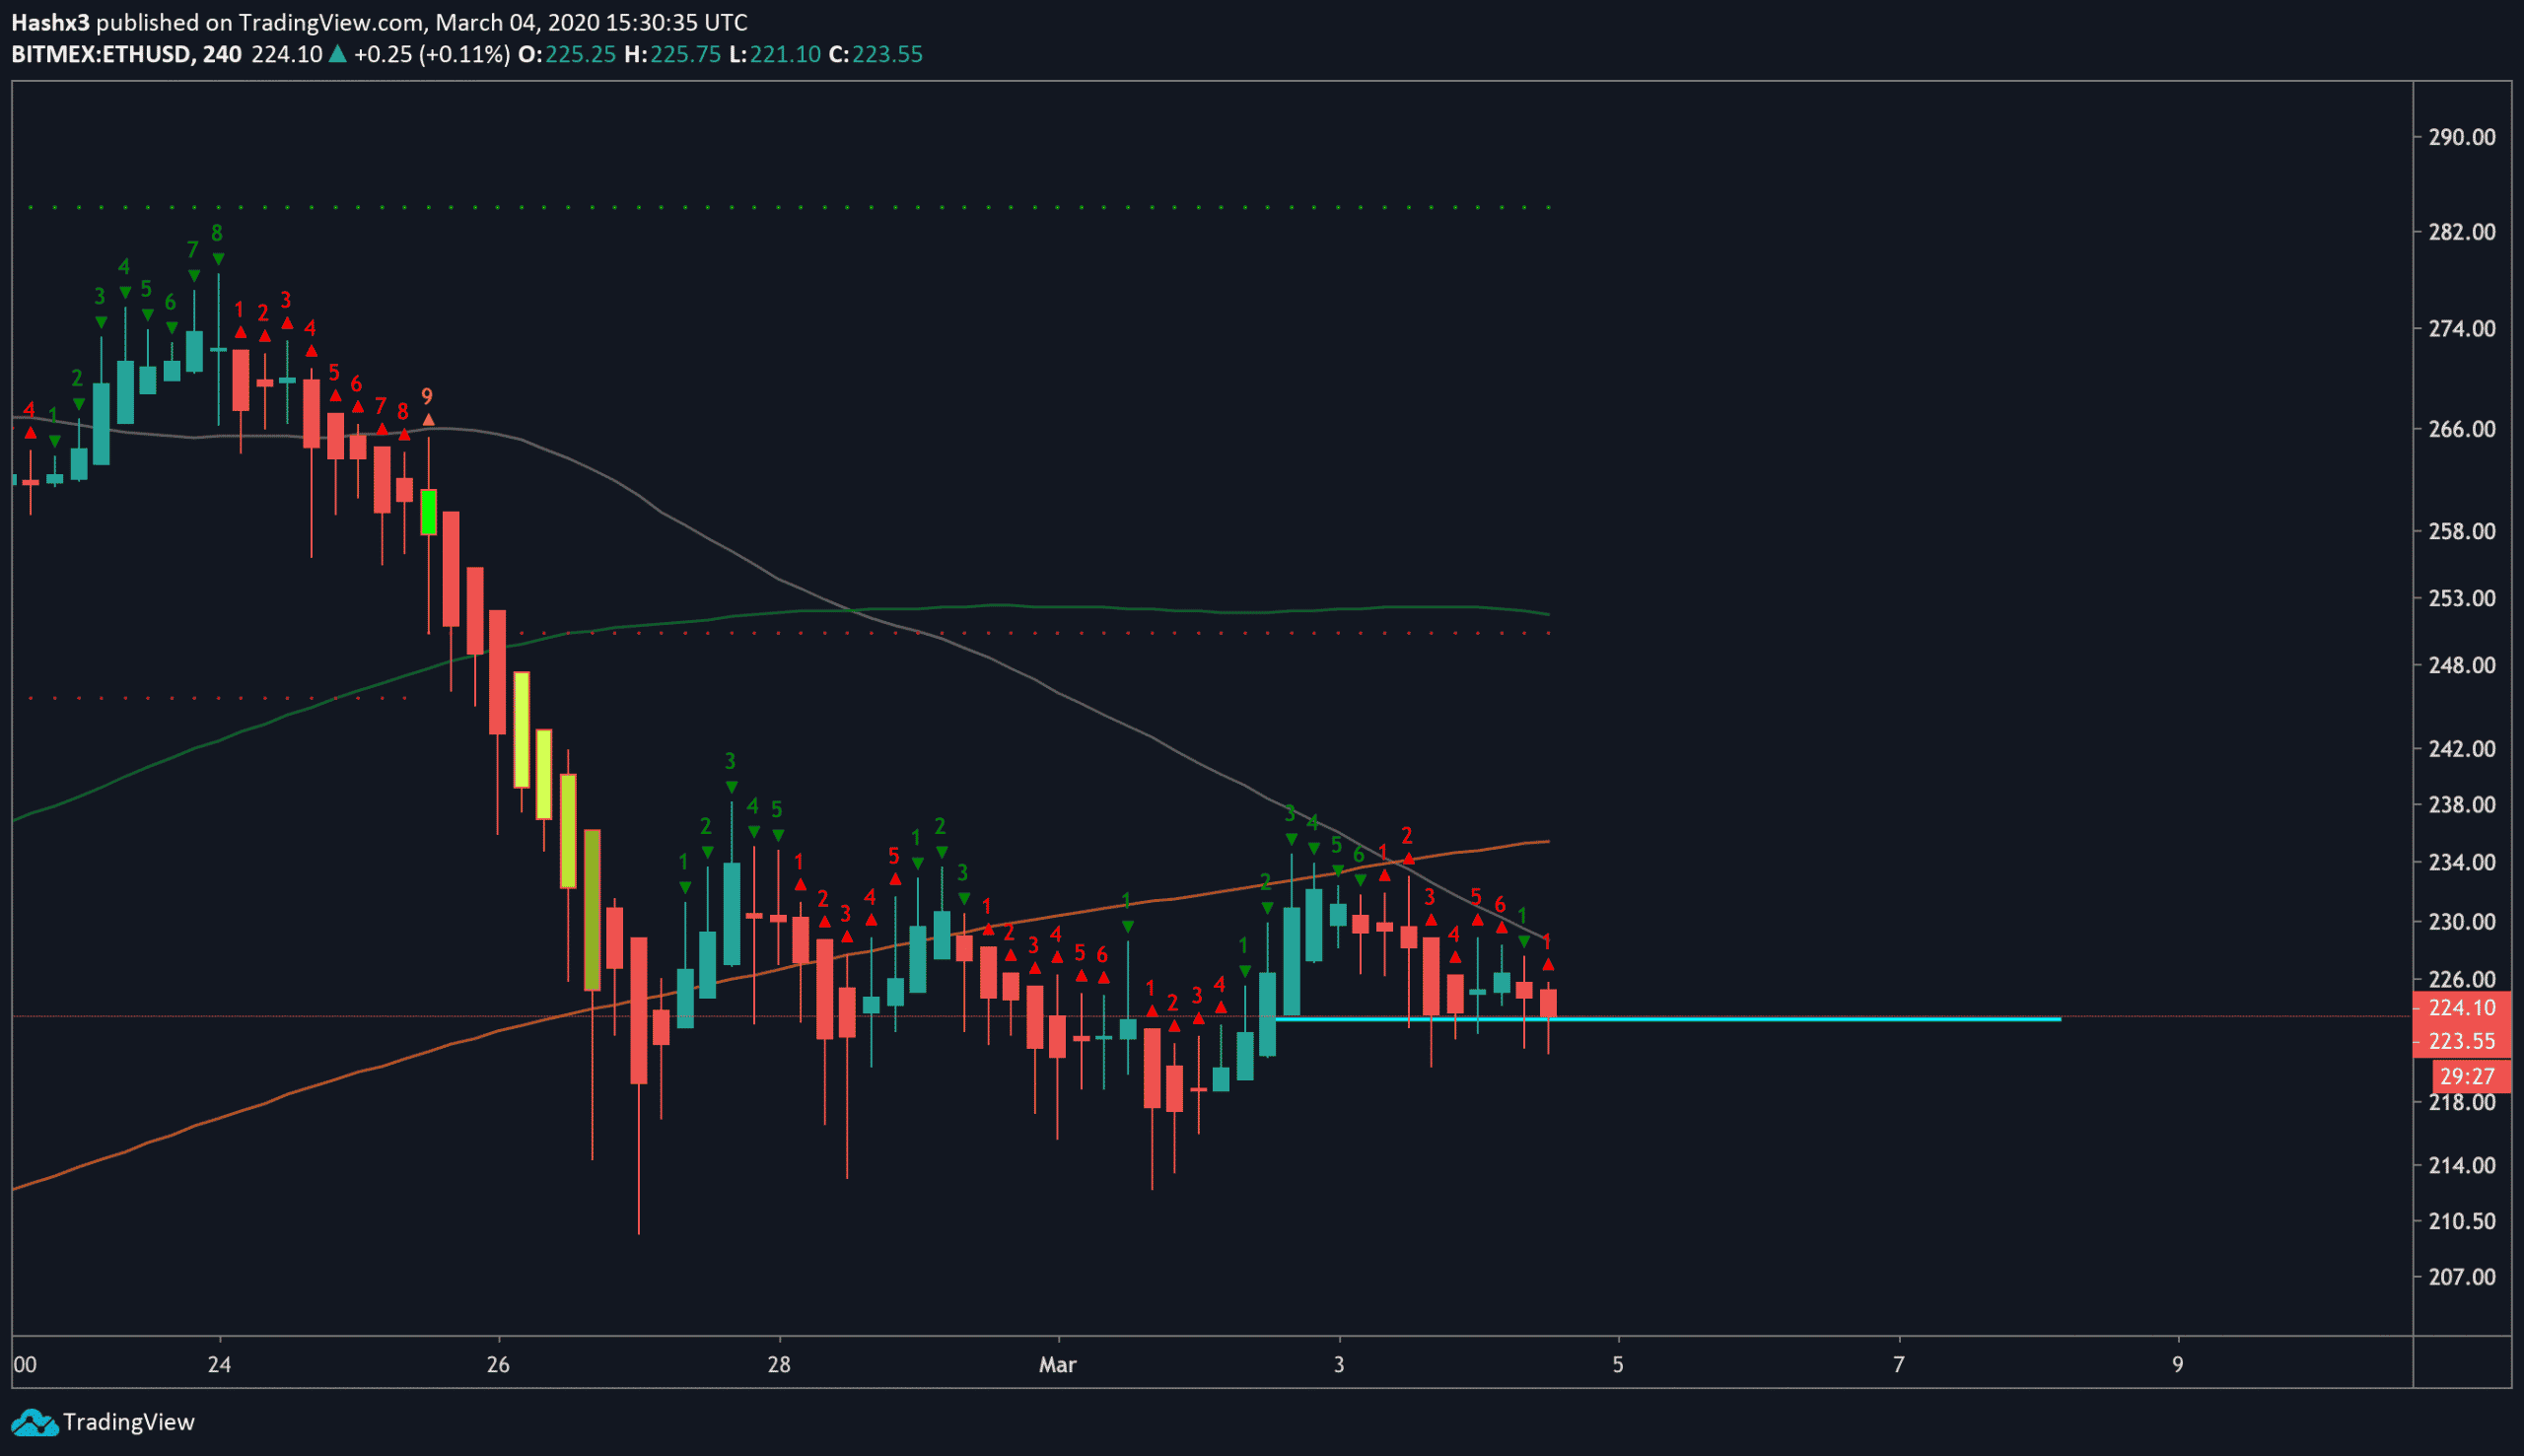
Using heikin ashi candles helps us smooth out the data to get a true picture of the momentum of the trend. As you can see, Ethereum has been experiencing a good deal of bearish chop as the moving averages serve as resistance. Furthermore, you’ll notice that the 50MA (grey) has now created a death cross by crossing over both the 128MA (green) and the 200MA (orange). While moving averages are lagging indicators, they will serve as resistance levels for the bulls.
Long Term Outlook
From a macro perspective, Ethereum is unlikely to be a long term store of value. It is certainly possible if things change. However, the current structure of Ethereum does not have a hard cap on the total supply, and a small secluded group of developers decide the inflation schedule. In Bitcoin’s code, this is not the case. Ultimately, Ethereum is not hard money in the way Bitcoin is.