
Trading Insights
How to Trade a Stock Market Trend, & How to Get Out Before it Ends
They say, “the trend is your friend” — But what is considered a trend? And how can you know when it’s running out of steam? Find out inside.
One of the most effective ways to be a successful trader is to identify stock market trends. It’s easier said than done — but by following a few simple “tells,” you can better understand when a trade still has room to run in your direction, and when it’s running out of gas. Below, we’ll talk about how you can combine unusual options activity with a simple technical analysis strategy to know which direction a trade is trending, and when the trend is over.
1. Using Unusual Options Activity to Spot Stock Market Trends
One of our favorite options trading strategies at Market Rebellion is to let the “smart money” lead the way with unusual options activity.
What is unusual options activity? Unusual options activity is when we spot someone (likely a hedge fund or massive institution) making an abnormally large option trade that, on the surface, doesn’t make sense.
Perhaps they’re paying boatloads to make a prediction that a small, under-the-radar biotech company which doesn’t often make large price movements will soar 30% in a week. Well, we would consider that unusual. That’s because if there’s no obvious reason why someone with a lot of money is making a big trade, it’s possible that the buyer knows something that we as individual traders don’t. Here’s a recent example of exactly this taking place, where the information that the buyer likely had was about an upcoming buyout in IMGN.

Of course, it isn’t just insider information that we see these purchases in. Often, these are purchases based on some of the same indicators we all look at, that help guide us to where the momentum is. That’s what we’ll be focusing on in this article, with an example of repeated bullish call buying in Coinbase (COIN).
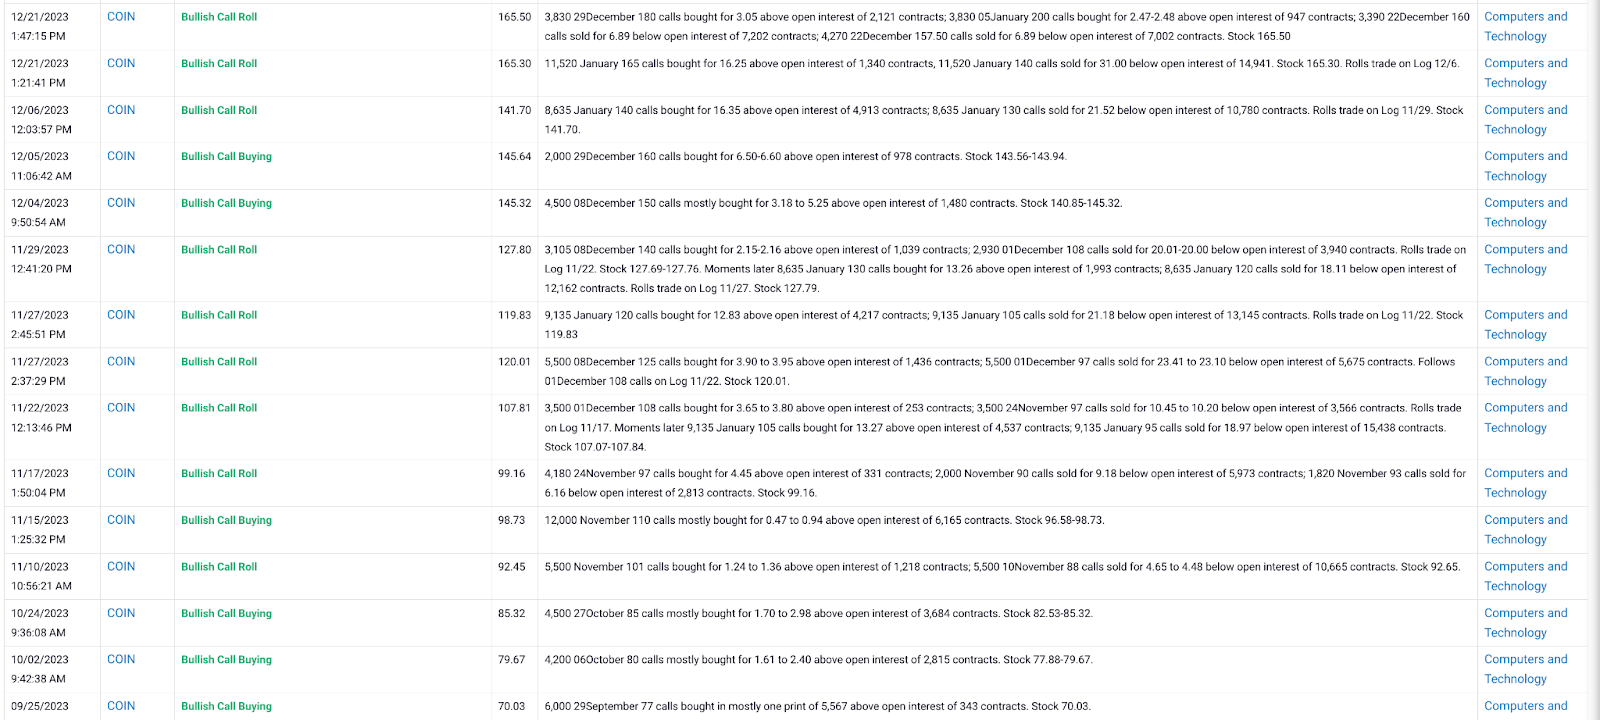
Now, we didn’t filter this UOA. It’s just that all of the unusual activity we saw in COIN over the past three months has been extremely bullish. When you see consistent, repeated bullish buying in a name like this, it should be a flashing “attention” sign. In this instance, we’re not looking at a purchase driven by some secret insider information — we’re just looking at a classic momentum trade, where someone has ridden the uptrend in Coinbase from $70.03 to a present price of about $170.
You might have thought, seeing Coinbase rise from $70.03 to $100 that the rally was already overdone. But you would have been wrong — and the smart money would have been telling you that the whole time, as they continued to buy in, risking millions for more upside. The thesis here is, as Jon says, “As long as they are still in the trade, I’m still in the trade.”
How can you tell if they’re still in? You can simply check the open interest at the end of each day to see if they continue to hold that option — and you can check the UOA to see if and where they’re rolling to. As an example, in the screenshot above, you can see that on November 29th, several of these trades were rolled to December 8th expiring $140 strike calls. That means they sold the old position and simultaneously bought a new position with the same directional bias, but a new strike or expiration, giving them more time to be right in this trade.
However, unusual options activity is just one piece of the puzzle. There’s another way you can cross-check this trend to see how strong it is, and whether it’s still got momentum – a simple moving average crossover.
2. Using Moving Average Crossovers to Spot Trends, and Find Out When They End
Even the strongest of trends have pullbacks. Pauses. Small breaks where the buyers or sellers have to take a breather. For bullish movements like this one in Coinbase, that means red days which usually don’t feel very good.
However, those red days don’t always mean that a trend is done. In the above Coinbase example, this stock has taken quite a few “breathers” between September 25th and present day — including today. But in the midst of those pauses and pullbacks, one indicator continued to flash “BUY” the whole time: The 3 & 8 day moving average.
This is a short-term moving average, meaning it’s sensitive to market movements, and it’s also a combination of averages that have been back tested by a variety of platforms with great results. In this instance, since we’re looking at a medium-term trade, we’ll use days as our periods here.
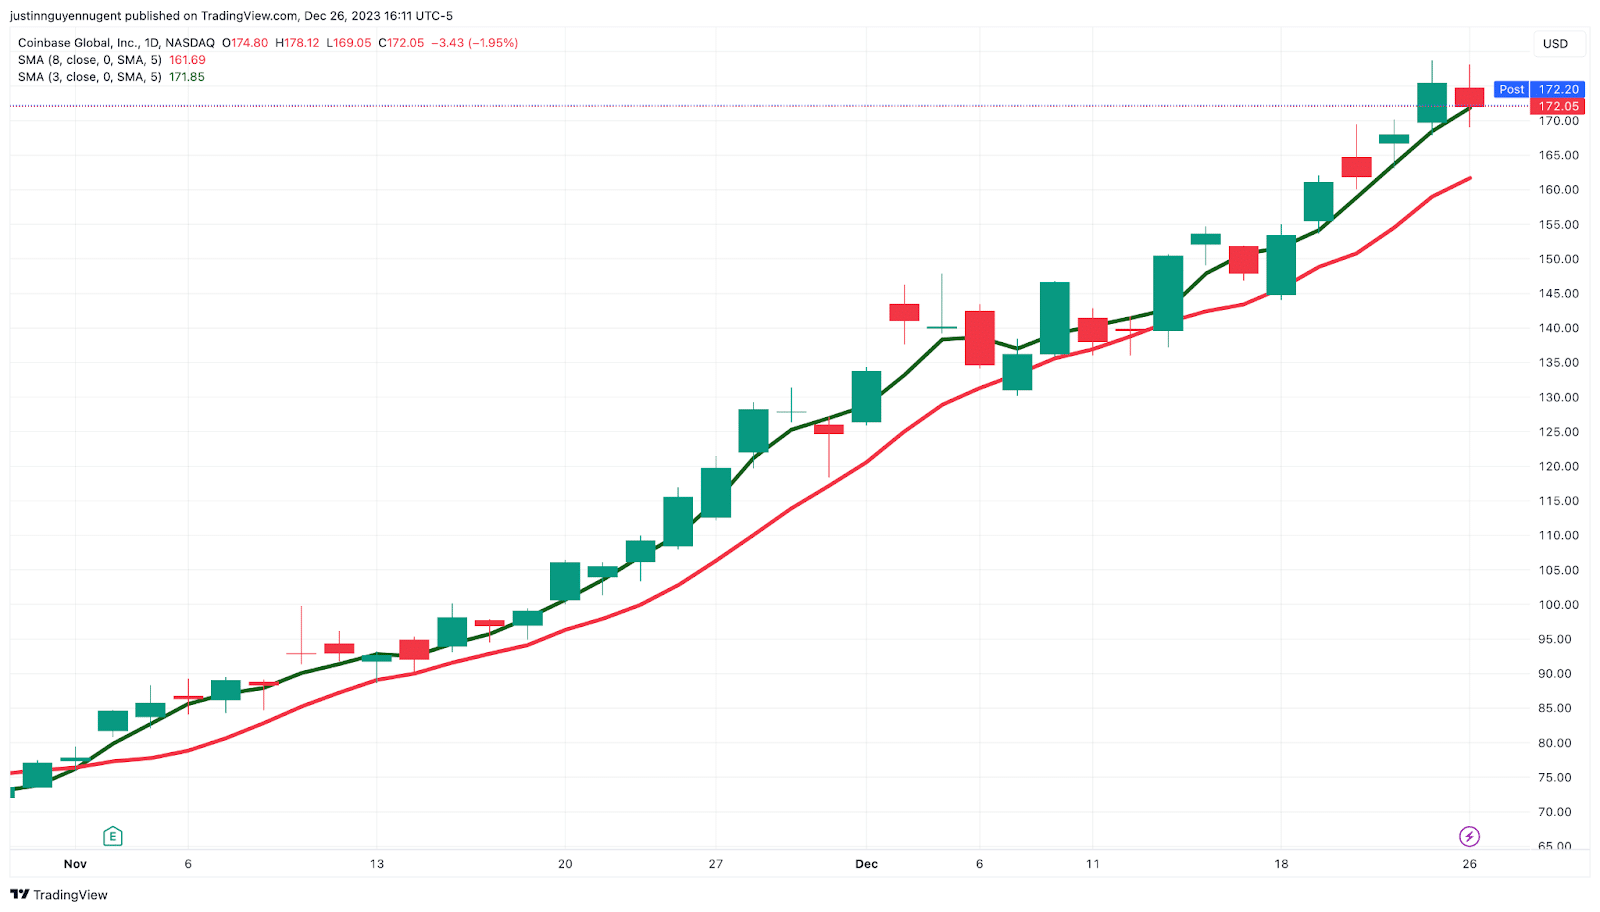
In the chart above, we’re using the green line as the 3 day moving average, and the red line as the 8 day moving average. The way you use this indicator is simple — you trade in the direction of the shorter-term 3 day moving average. When the 3 day moving average is above the 8 day moving average, it’s bullish. When the 3 day moving average is below the 8 day moving average, it’s bearish. If you enter a bullish position on a cross-up (the day moving average crosses above the 8 day moving average), you’ll look to sell when the averages cross back over.
Notice in the example above, they cross with Coinbase trading just over $75 dollars per share on the first trading day of November. Despite seeing 14 red candles in the chart, the moving averages never crossed back, even in the present day. This indicator allows you to see through the “pullbacks” into the trend itself — if the trend is still bullish, and the unusual options activity is still bullish, you should still be bullish.
Conclusion – Following Trends is the Easiest Way to Make Short and Medium Term Trades
There are plenty of trading strategies out there — but for me, these strategies have led the way. And believe me, I’ve tried a lot of strategies. They all have their pros and cons, and they all have environments they are good and bad at. For instance, in the strategy above, these moving average crossovers only work when you can find something that’s trending in a particular direction. If a stock is mostly moving sideways, or extremely volatile (up and down on a regular basis with no particular direction), this strategy won’t work. You have to be selective with the stocks you choose. However, when you do find a market that’s trending, and you see supporting evidence in the form of smart money that’s following that trend, you’ll get the opportunity to pick an A+ trading set-up, and you’ll be happy to have learned this strategy.
For more UOA trades like these ones in Coinbase every single week, complete with trade ideas, contracts, and more, try UOA today.
