
Trade Ideas/Updates
NEW ALERT: Cashflow from the Company Who Says, “The Future Is What We Make It” (HON)
WAIT! New to Instant Cashflow? If you’re a new student here and you have not gone through our Quick Start or Masterclass series, we do not suggest taking action on the information below. Click here and review our educational material first. Then, review our alerts like the one below, start paper trading, and attend…

|
WAIT! New to Instant Cashflow? If you’re a new student here and you have not gone through our Quick Start or Masterclass series, we do not suggest taking action on the information below. Click here and review our educational material first. Then, review our alerts like the one below, start paper trading, and attend our live Q&A to gain confidence and knowledge first. This is a marathon not a sprint. Take the time to learn and build confidence before taking action. The Instant Cashflow strategy requires knowledge of selling options. Don’t be lazy or take shortcuts. Use the resources we’re providing each week to learn before you do. Also, remember that we do NOT give personalized investment advice and these are NOT recommendations. If that’s all clear to you, then read on… |
Cashflow from “The Future Is What We Make It”
Honeywell Technologies (Nasdaq: HON) — Company Profile
Company Overview
Honeywell Technologies is a global industrial technology and automation company headquartered in Charlotte, North Carolina. The company operates under the HON ticker on Nasdaq and is focused on helping industrial customers improve productivity, efficiency, safety, and reliability through automation, controls, software, sensors, and connected technologies.
Importantly, HON today is a substantially different company from the historical Honeywell conglomerate. Honeywell completed the spin-off of Solstice Advanced Materials in October 2025 and Honeywell Aerospace in June 2026. Honeywell Technologies is now positioned as a pure-play automation company, while Honeywell Aerospace trades separately under HONA and Solstice Advanced Materials under SOLS.
Ticker: HON
Exchange: Nasdaq
CEO: Vimal Kapur
Headquarters: Charlotte, North Carolina
Industry: Industrial Technology / Automation
Primary Focus: Building, process, and industrial automation
What Honeywell Does
Honeywell Technologies provides the hardware, software, controls, and systems that allow buildings and industrial operations to function more efficiently and increasingly with less human intervention. Management describes the company’s long-term opportunity as helping industry move from automation toward autonomy.
The company currently operates through three primary business segments:
Building Automation
Building Automation provides technologies used to control and manage commercial buildings. Its products and services include building-management systems, fire and life-safety systems, security and access controls, sensors, and other technologies designed to improve building efficiency and performance.
This is currently Honeywell’s largest segment. In Q2 2026, Building Automation generated approximately $2.0 billion in sales, with organic sales growing 9%. Segment margin reached 27.1%. Growth has been particularly strong in areas such as data centers and hospitality.
Process Automation and Technology
This segment provides automation technologies for complex industrial processes. Customers include companies operating refineries, chemical facilities, LNG operations, power facilities, and other large industrial plants.
Honeywell’s products help customers monitor equipment, control industrial processes, improve efficiency, reduce downtime, and increasingly automate operating decisions.
Q2 2026 sales were approximately $1.68 billion, with a segment margin of 22.1%.
Industrial Automation
Industrial Automation serves manufacturing, logistics, warehousing, and other industrial applications. Technologies include sensors, controls, productivity systems, automation equipment, and related software.
Q2 2026 sales were approximately $1.50 billion, with a segment margin of 17.2%.
The New Honeywell
The most important development for investors is Honeywell’s dramatic portfolio transformation.
Historically, Honeywell combined aerospace, industrial automation, building technologies, specialty materials, and other businesses under one corporate structure. Management has now separated that portfolio into three independent publicly traded companies:
Honeywell Technologies (HON) — Automation
Honeywell Aerospace (HONA) — Aerospace and defense technologies
Solstice Advanced Materials (SOLS) — Specialty chemicals and advanced materials
The aerospace separation was completed on June 29, 2026, following the October 2025 Solstice separation.
That means historical Honeywell financial results aren’t directly comparable with the company investors own through HON today. Going forward, HON should increasingly be evaluated as an industrial automation company rather than as a diversified industrial conglomerate.
Current Financial Snapshot
Honeywell Technologies reported Q2 2026 sales of $5.19 billion, excluding the separated Aerospace business. Organic sales increased 4% year over year.
Segment profit reached $985 million, up 9%, while segment margin expanded 100 basis points to 19.0%. Adjusted EPS was $1.95, up 10% year over year. Free cash flow was $456 million.
Orders increased 16%, producing a backlog of approximately $20 billion. That backlog provides Honeywell with considerable visibility into future revenue, although the timing and profitability of backlog conversion remain important variables for investors.
Growth Drivers
Honeywell’s investment case centers on several long-term trends.
Automation and labor productivity: Manufacturers and building operators continue investing in technologies that allow them to produce more with fewer resources.
Artificial intelligence and autonomy: Honeywell is attempting to move beyond conventional automation, in which machines execute predetermined instructions, toward systems capable of increasingly autonomous monitoring and decision-making.
Data-center construction: Rapid growth in data centers creates demand for sophisticated building controls, fire systems, energy management, cooling-related controls, and security technologies. Honeywell reported strong Building Automation orders in Q2 2026, including robust growth from data-center customers.
Industrial digitalization: Industrial plants increasingly combine physical equipment with sensors, software, analytics, and connected control systems.
Large installed base: Honeywell already has equipment and systems operating throughout buildings and industrial facilities worldwide. That installed base can create recurring opportunities for service, upgrades, software, replacement equipment, and additional automation products.
Portfolio Strategy
Honeywell has aggressively reshaped its portfolio through acquisitions and divestitures. Since 2023, the company reports completing approximately $11.5 billion of acquisitions, including Compressor Controls Corporation, SCADAfence, Carrier’s Access Solutions business, Air Products’ LNG business, Sundyne, Li-ion Tamer, and Johnson Matthey’s Catalyst Technologies business.
At the same time, Honeywell has sold or separated businesses that management considers less central to its automation strategy. This makes portfolio execution an important part of the HON investment thesis—the company isn’t simply relying on organic growth but actively reallocating capital toward businesses it believes can strengthen its automation platform.
Competitive Advantages
Honeywell’s principal strengths include a large global installed base, decades of industrial engineering expertise, established customer relationships, mission-critical products, high switching costs in certain applications, and the ability to integrate hardware, controls, software, and services.
Many Honeywell systems are embedded deeply within customer operations. Replacing an industrial control or building-management platform can involve more than simply purchasing a competing product. Customers may face installation costs, downtime, retraining, system integration, and operational risk.
That can make the installed base economically valuable well beyond the original equipment sale.
Key Risks
The new Honeywell also introduces several uncertainties.
Post-separation execution: HON has only recently become a standalone pure-play automation company. Investors have limited history for evaluating the business in its new form.
Industrial cyclicality: Capital spending by manufacturers and industrial customers can weaken during economic downturns.
Acquisition integration: Honeywell has spent billions acquiring businesses. The investment thesis depends partly on successfully integrating those businesses and earning adequate returns on the capital deployed.
Technology competition: Industrial automation is highly competitive, and Honeywell must continue investing as AI, software, robotics, and autonomous systems evolve.
Portfolio complexity: Even after the major spin-offs, Honeywell continues reshaping its portfolio through acquisitions and divestitures, making underlying operating trends more difficult to evaluate during the transition.
Investment Profile
The investment case for HON has changed substantially.
An investor buying Honeywell historically received exposure to aerospace, automation, buildings, industrial technologies, and specialty materials. An investor buying HON today is making a much more concentrated bet on automation.
The central questions are therefore no longer primarily about whether Honeywell’s aerospace cycle can remain strong. They are whether Honeywell Technologies can capitalize on industrial automation, data-center investment, digitalization, and the transition toward increasingly autonomous industrial systems—and whether management can convert those opportunities into sustained organic growth, expanding margins, and strong free cash flow.
The transformation gives investors a cleaner company to analyze. It also removes some of the diversification that once defined Honeywell.
Bottom line: Honeywell Technologies is no longer the old Honeywell conglomerate with a new label. HON is now essentially a bet on the proposition that the next generation of industrial productivity will come from increasingly intelligent automation—and that Honeywell’s enormous installed base gives it a valuable position from which to capture that transition.
Below are the four main types of transactions we use in Instant Cashflow. You can review each transaction type within our Masterclass Series.
1) Credit Spreads
2) Covered Calls
3) Naked Puts
4) Stock Replacement
Here’s a summary of the trade ideas, and then keep scrolling down for a breakdown of each and a tutorial video on how to place the trade:
|
SUMMARY OF THIS WEEK’S TRADE IDEAS: Underlying Stock: Honeywell (HON) #1 Credit Spread Trade: Sell to open (STO) 1 HON Aug 28 220/210 vertical put spread (14 days to expiration) at a limit of $1.00. Good for the Day. (*Only place this trade if the stock is $232.50 or higher*) We suggest you do not sell the put spread unless you’re willing and able to buy the shares for the short strike price in the event of assignment. #2 Covered Call Trade: Buy 100 shares HON and simultaneously sell to open (STO) 1 Aug 28 $230 call (14 days to expiration) at a net debit of $226.50. Good for the Day. (*Only place this trade if the stock is $232.50 or higher*) #3 Naked Put Trade: Sell to open (STO) 1 HON Aug 28 $220 put (14 days to expiration) at a limit of $1.15. Good for the Day. (*Only place this trade if the stock is $232.50 or higher) We suggest you do not sell the put unless you’re willing and able to buy the shares for the short strike price in the event of assignment. #4 Stock Replacement Trade: Buy to open (BTO) 1 HON November 20 $200 call (98 days to expiration) at a limit of $39. Good for the Day. (*Only place this trade if the stock is $232.50 or higher |
Read on for the different trade plans and tutorials on the different ways you can generate cash flow from this opportunity…
Four Instant Cashflow Trade Plans
Each one of these four has a different level of risk and reward. And each one has different steps to conduct the transaction within a brokerage account.
We suggest only trading one of the following depending on your goals and risk tolerance. The instructions and videos for each are broken down in detail, below.
Also, remember, the following trades are listed as one contract, but you can always increase the quantity if you’re comfortable.
However, be sure you’re not investing more money than you can afford to lose.
No matter how confident you are in a trade, it’s best to keep the position sizes small relative to the total account size.
As a general rule, don’t put more than 1% to 2% of your total account value into any one trade.
Remember when trading: More things can happen than will happen. Managing risk is the most important thing. And the market doesn’t care what you think. So be disciplined and manage your risk.
If you’re uncertain about anything, don’t take action. Bring your questions to our team’s weekly Q&A calls and level-up your confidence.
We suggest you do not sell the put spread unless you’re willing and able to buy the shares for the short strike price in the event of assignment.
Let’s dive in…
|
STRATEGY #1: CREDIT SPREAD
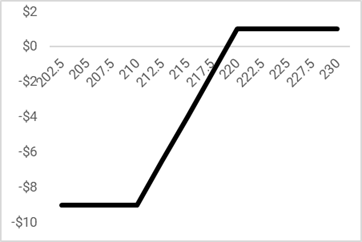
Why Use This Strategy? We suggest you do not sell the naked put unless you’re willing and able to buy the shares for the strike price in the event of assignment. The main reason for a put credit spread is it’s a safer version of the naked put. A naked put has unlimited downside risk, at least to a stock price of zero. Credit spreads are always limited risk and limited reward. How Do You Place This Trade? If you choose the credit spread, just place the following order: (*Only place this trade if the stock is $232.50 or higher What’s the Risk? The credit spread has the following risk graph: Max gain = $1.00 (for all stock prices above $220 at expiration). Max loss = $9 (for all stock prices below $210 (at expiration). Expiration breakeven = $219 |
Credit Spread Video Tutorial
|
STRATEGY #2: COVERED CALL
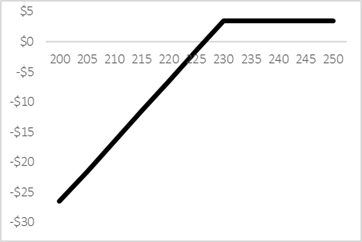
Why Use This Strategy? The main reason for using the covered call is to provide a relatively small hedge to the downside risk in the strategy. By selling calls, you’ll collect premiums over time, which reduces the effective amount you’ve invested. The covered call strategy is expected to have lower risk–and lower returns–over time. How Do You Place This Trade? To use the covered call strategy, you must own 100 shares for every call you sell. If you choose to use the covered call but don’t currently own shares, you can buy shares and sell the call in one trade (your broker’s platform may also call this “covered stock” or a “buy write”). Just place the following order: Buy 100 shares HON and simultaneously sell to open (STO) 1 Aug 28 $230 call (14 days to expiration) at a net debit of $226.50. Good for the Day. (*Only place this trade if the stock is $232.50 or higher What’s the Risk? The covered call has the following risk graph:
Max gain = $3.50 (for all stock prices above $230 at expiration) Max loss = $226.50 (unlimited to a stock price of zero) Expiration breakeven = $226.50 The risk profile for the covered call has the same shape as the naked put (see strategy below). Whether using the covered call or naked put, always be sure you’re willing to assume the full downside risk. We expect to write new calls to continue to cashflow this position over time. |
Covered Call Video Tutorial
|
STRATEGY #3: NAKED PUT
Why Use This Strategy? We suggest you do not sell the naked put unless you’re willing and able to buy the shares for the strike price in the event of assignment. There are many reasons for using naked puts. First, you can sell to generate cashflow. If the stock price sits still or rises, you’ll collect the put premiums over time without owning the shares. However, it only works if the stock price remains above the strike at expiration. If the stock price falls below the breakeven price, you’ll end up with losses. A longer-term approach is to use naked puts to acquire shares. In other words, if the share price falls below the strike at expiration, you can take the assignment and buy shares. Once you own the shares, you can sell calls (covered calls) to continue to cashflow over time.
How Do You Place This Trade? If you choose the naked put, just place the following trade: (*Only place this trade if the stock is $232.50 or higher
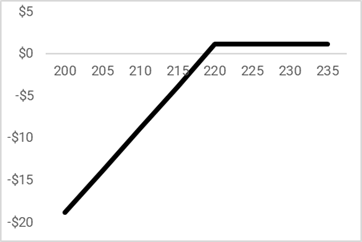
What’s the Risk? The naked put has the following risk graph:
Because of the large downside risk, the broker will have a margin requirement, which is an amount of cash set aside in the event the stock price falls. While brokers are allowed to set their own requirements, most will require about 25% of the strike’s price, so $220 * 100 shares * 25%, or $5,500.
However, if you’re not approved for naked options, you may still be able to do the trade with a “cash secured” put, which means you must post the full assignment value. Another alternative is to use the previously mentioned credit spread.
Potential margin calls: For any naked option position, you’re subject to “margin calls” or “maintenance calls.” These are additional cash requirements should the stock price fall below a certain level. Before you sell any naked put, it’s a good practice to have additional money over and above the initial margin requirement. The maximum you could ever need would be to assume you got assigned on the naked put and buy 100 shares at the $220 strike, or $22,000. However, if you’re using a cash-secured put, you’ll never have a margin call.
Max gain = $1.15 (for all stock prices above $220 at expiration).
Max loss = $218.85 (unlimited to a stock price of zero).
Expiration breakeven = $218.85
The risk profile for the naked put has the same shape as the covered call (see strategy above). Whether using the covered call or naked put, be sure you’re willing to assume the full downside risk–because you are.
|
Naked Put Video Tutorial
|
STRATEGY #4: STOCK REPLACEMENT
Why Use This Strategy?
The stock replacement strategy is used to create a cheaper way to buy shares. The current price for a share of HON is $234.05. But when you buy options using the stock replacement strategy, you’re only paying $39. That’s just 17% of the stock’s price.
This gives you roughly 6:1 leverage while ensuring a $39 maximum loss if the stock falls below $200 at expiration.
You could use this strategy to take a position in the underlying with a longer-term view. Remember, for longer-term positions, it’s a big advantage to scale in over time. If possible, leave room for additional purchases in the future.
How Do You Place This Trade?
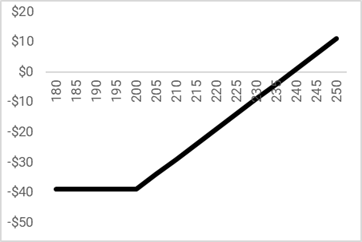
If you choose the stock replacement strategy, just place the following order: Buy to open (BTO) 1 HON November 20 $200 call (98 days to expiration) at a limit of $39. Good for the Day. (*Only place this trade if the stock is $232.50 or higher) What’s the Risk? The risk graph for this stock replacement call is shown below. The strategy has limited risk and unlimited potential reward:
Max gain = unlimited
Max loss = $39 (price paid)
Expiration breakeven = $239
We’re initiating a position at this level for a longer-term hold. However, we may decide to sell calls against it or roll to a higher strike in the future. |
Stock Replacement Video Tutorial
If you’re confused by ANYTHING above, wait for our live Q&A zoom call next week and ask your questions live.
Remember, this is a learning process.
So don’t be hasty, just write down your questions and use our calls to learn before you take any actions. So, read this multiple times. List your questions.
We highly recommend attending—and participating—in our weekly Q&A discussions. You’ll find them invaluable during your awesome cashflow journey!
– Pete Najarian, Bill Johnson & Stu Dorfman

IMPORTANT DISCLAIMERS
THIS PRESENTATION IS FOR EDUCATIONAL AND INFORMATIONAL PURPOSES ONLY AND DOES NOT CONSTITUTE INVESTMENT ADVICE, NOR THE RECOMMENDATION OF ANY SECURITY, TRADING STRATEGY OR FINANCIAL INSTRUMENT OF ANY KIND. THE INFORMATION IN THIS PRESENTATION DOES NOT CONSTITUTE TAX ADVICE, LEGAL ADVICE, OR OTHER PROFESSIONAL ADVICE OF ANY KIND.
ALL INVESTMENTS INVOLVE A DEGREE OF RISK, AND THE PAST PERFORMANCE OF A SECURITY, INDUSTRY, SECTOR, MARKET, FINANCIAL PRODUCT, TRADING STRATEGY, OR INDIVIDUAL’S TRADING DOES NOT GUARANTEE FUTURE RESULTS OR RETURNS. OPTIONS AND FUTURES HAVE UNIQUE RISKS THAT INVESTORS MUST FAMILIARIZE THEMSELVES WITH BEFORE TRADING THESE INSTRUMENTS.
REFERENCE TO SPECIFIC SECURITIES SHOULD NOT BE CONSTRUED AS A RECOMMENDATION TO BUY, SELL OR HOLD THAT SECURITY. SPECIFIC SECURITIES ARE MENTIONED FOR EDUCATIONAL AND INFORMATIONAL PURPOSES ONLY. THE PRESENTATION SHALL NOT CONSTITUTE AN OFFER TO BUY OR SELL ANY SECURITIES NOR SHALL IT CONSTITUTE A RECOMMENDATION OF ANY SECURITY.
THIS PRESENTATION AND INFORMATION CONTAINED THEREIN IS DISTRIBUTED AS EDUCATIONAL MATERIAL AND DOES NOT CONSTITUTE “INVESTMENT ADVICE” UNDER APPLICABLE EXEMPTION FROM INVESTMENT ADVISOR REGISTRATION INCLUDING BUT NOT LIMITED TO SECTION 202(A)(11)(D) OF THE INVESTMENT ADVISERS ACT OF 1940 (ADVISERS ACT) THE “PUBLISHERS’ EXEMPTION).
WHILE THE INFORMATION IN THIS PRESENTATION IS BELIEVED TO BE ACCURATE, NO REPRESENTATION OR WARRANTY, EXPRESS OR IMPLIED, IS MADE AS TO ITS ACCURACY OR COMPLETENESS OR FITNESS FOR ANY PURPOSE.
INVESTORS ARE FULLY RESPONSIBLE FOR ANY INVESTMENT DECISIONS THEY MAKE. SUCH DECISIONS SHOULD BE BASED SOLELY ON AN EVALUATION OF THEIR FINANCIAL CIRCUMSTANCES, INVESTMENT OBJECTIVES, RISK TOLERANCE, AND LIQUIDITY NEEDS.
LIVE TRAINING AND EDUCATION REFERRED TO IN THE CONTENT IS PROVIDED BY MARKET REBELLION. VIEWPOINTS AND OPINIONS SHARED IN THIS PRESENTATION ARE FOR EDUCATIONAL AND INFORMATIONAL PURPOSES ONLY. THE VIEWS EXPRESSED BY US ARE OUR OWN, AND NOT NECESSARILY THAT OF MARKET REBELLION. ALL INVESTMENTS INVOLVE RISK, AND THE PAST PERFORMANCE OF ANY ASSET, INDUSTRY, SECTOR, MARKET, FINANCIAL PRODUCT, TRADING STRATEGY, OR INDIVIDUAL’S TRADING DOES NOT GUARANTEE FUTURE RESULTS OR RETURNS. YOU ARE FULLY RESPONSIBLE FOR YOUR OWN INVESTMENT DECISIONS, AND THEY SHOULD BE BASED SOLELY ON AN EVALUATION OF YOUR FINANCIAL CIRCUMSTANCES, INVESTMENT OBJECTIVES, RISK TOLERANCE, AND LIQUIDITY NEEDS.
REFERENCES BY THE PRESENTERS TO THE PERFORMANCE OF ANY PARTICULAR SECURITY OR TRADE ARE SOLEY FOR THE PURPOSE OF ILLUSTRATION. NO GUARANTEE OR ASSURANCE CAN BE MADE THAT TRADING RESULTS EXPERIENCED BY VIEWERS OF THIS PRESENTATION WILL BE THE SAME OR SIMILAR TO THE REFERENCED EXAMPLES. THE PRESENTERS ARE HIGHLY EXPERIENCED INVESTORS AND MARKET PROFESSIONALS.