Announcement
Latest Short Interest Data For Period of 7/01/26 through 7/15/26:Current Read On Short Interest. NYSE -1.57% & NASDAQ 0.97%.
Shorts Seeing Positions Grow Include RKT RIG STLA SOC ABEV JOBY SLB ORCL SPCX GRAB ONDS SKHY CSCO KEEL FRMI IREN GRAB NVDA The latest short interest data is out from June 30th to July 15th (on a settlement date with trade date one day earlier). NYSE Short Interest fell by -1.57% while the NASDAQ Short…
By Geoff Garbacz | Market Rebellion · July 26, 2026
Shorts Seeing Positions Grow Include RKT RIG STLA SOC ABEV JOBY SLB ORCL SPCX GRAB ONDS SKHY CSCO KEEL FRMI IREN GRAB NVDA
The latest short interest data is out from June 30th to July 15th (on a settlement date with trade date one day earlier). NYSE Short Interest fell by -1.57% while the NASDAQ Short Interest rose by 0.97%. The S&P 500 rose by 0.97%, NASDAQ Composite by 0.21% and the Russell 2000 fell by -1.59% in the latest collection period.
It should be noted since the beginning of 2026 Short Interest on NYSE is up 15.34% while NASDAQ is up 22.23%. At some point, these shorts will be covered and the question is will it be at higher or lower levels? 2025 and 2026 results are below:

Yellow shading is year-end 2025. Blue shading is the highest level for NASDAQ ever and blue for NYSE is also new all time high. We are also showing the yearly changes since 2020. 2025 saw the biggest percentage change since we began tracking in 2020.
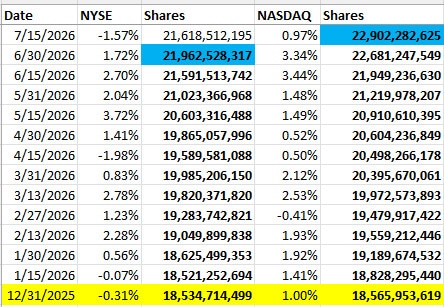
Individual stock data dropped last night in Erlanger Chart Room (ECR) and reports dropped this morning via email and in Erlanger Scans and Custom Scans inside of Chart Room. Going forward, we will produce this early look ahead of the Market Review that will be out tomorrow morning. Below is our tracking of short interest absolute data over the last year and a half.

3.58% of NYSE stocks at the end of June have been covered since December 15, 2021 when the low was seen on NYSE names. NASDAQ has seen 0.00% covered at the end of June have been covered since February 15, 2021 when the low was seen on NASDAQ names.
Current Range & Covers Table

History of Absolute Short Interest in Graphs – NYSE hit a new all time high on 6/30 and NASDAQ at a new all time high on 7/15, this update.
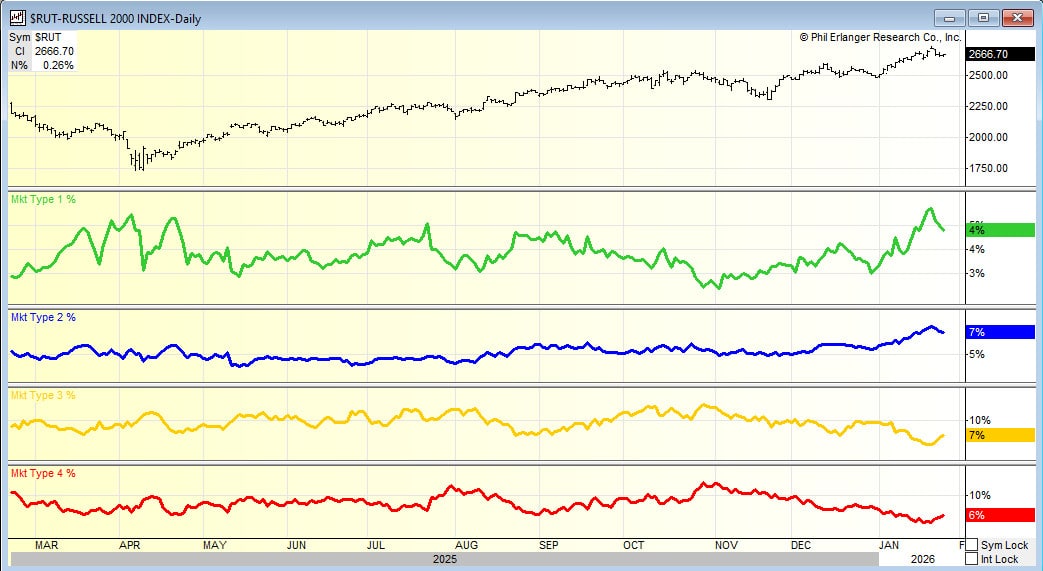
Types Chart of Interest – Types 1-4 reviewed. Short Squeezes (Type 1s) and Current Strength (Type 2s) see 1s rising and 2 range flat. Shorts Correct (Type 3s) and Long Squeeze (Type 4s) see 3s fallng as are 4s.
Current Types Chart
Sector Changes In Short Intensity Levels: 10 Sectors Saw An Increase in Short Intensity, 14 Sectors saw a decrease. 11 are above 50 Average Short Rank. None are under 40%.
We are adding a new statistic that a client suggested. The total Dollar amount of short positions each time we get an update of short interest. As we build history, this will be valuable data. Currently, $1.354 trillion mid July from $1.404 trillion at the end of late June is short.
The most shorted sector is Software at $242 billion from $259 billion in mid April followed by Semiconductors at $208 from $221 billion and in third Hardware/Equipment at $125 from $127 billion. Among the least shorted sectors are Household & Personal Products at $14 from $14 billion in the last update and Telecommunications at $14 billion from $14 billion.
The biggest increase was Energy up +10.89% to $40.5 billion. The biggest decrease was Software that fell -6.67% to $242 billion.
Erlanger Commitment of Short Sellers (ECOS) – 15 (+1) Sectors led by Dumb Short Sellers. 9(-1) are now led by Smart Short Sellers.
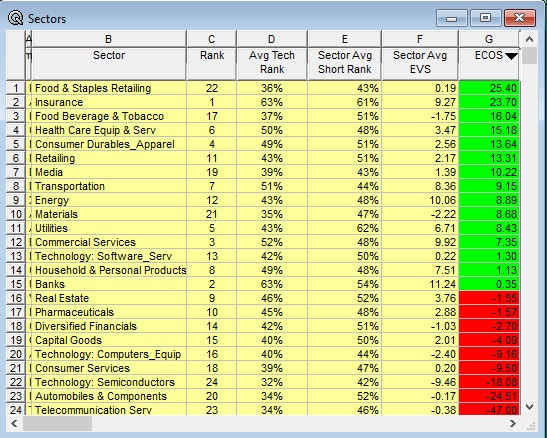
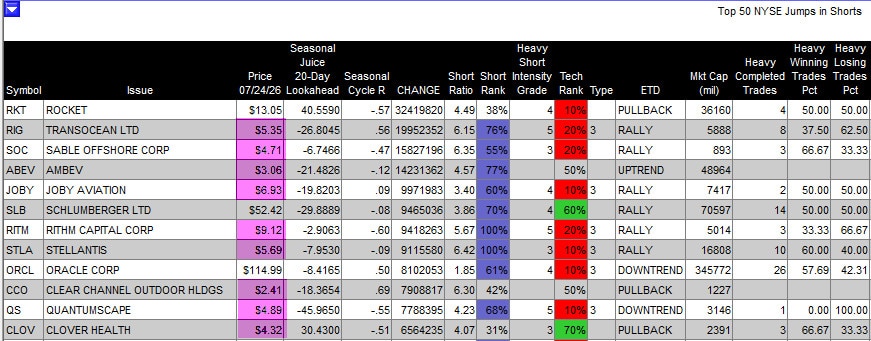
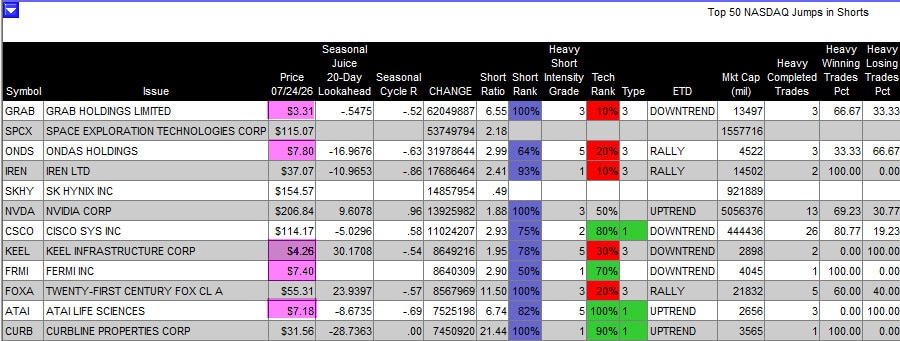
Biggest Jumps (Top Ten) in Short Interest for NYSE And NASDAQ – This scan can be found in Erlanger Chart Room along with the Biggest Drops in Short Interest for NYSE and NASDAQ. New Ideas on NYSE with heavy Short Intensity include RKT RIG STLA SOC ABEV JOBY SLB ORCL. New Ideas on NASDAQ with heavy Short Intensity include SPCX GRAB ONDS SKHY CSCO KEEL FRMI IREN GRAB NVDA.
As an side, it is surprising the willingness of shorts to tackle stocks under $10 and $5 in price.