Announcement
Seasonality Charts and Reports – August 2026
What Is Seasonality? In general, seasonality is some repeatable tendency of a financial instrument to move in relation to a particular influencing factor. That factor could be the time of year, the year of a decade, changes in interest rates, inflation, energy prices, etc. We focus on stock price action and seasonal cycles derived from…
What Is Seasonality?
In general, seasonality is some repeatable tendency of a financial instrument to move in relation to a particular influencing factor. That factor could be the time of year, the year of a decade, changes in interest rates, inflation, energy prices, etc. We focus on stock price action and seasonal cycles derived from the time of the calendar year.
Seasonal cycles do not cause prices to move a certain way. They simply reflect a measure of tendency. Ongoing price action is influenced by many factors, only some of which occur on a regular, repeated basis. Those factors that regularly cause a stock price to move a certain way at a particular time of the year may or may not be known, but their seasonal influence will show up in the seasonal indicators and can be qualified by several techniques to measure the breadth and consistency of a stock’s seasonal pattern.
The trading process typically begins with the prelude of one or more signals from setup criteria, and then the trade is made when the market moves sufficiently in the anticipated direction to set off a trigger indicator. After the entry trade, “monitoring” indicators are used to exit the trade.
Video Information: Using Seasonality to Pick Stocks – Part 1 and Part 2
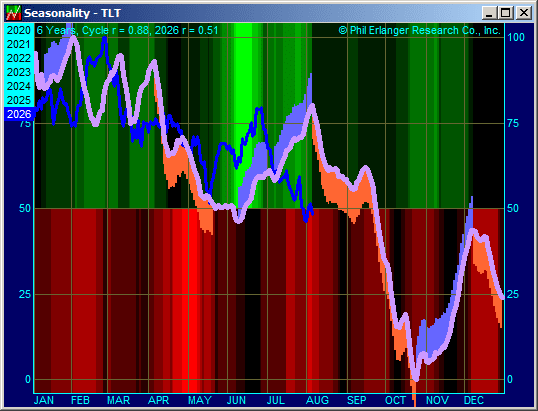
We highlight August seasonality for Major Index ETFs, Commodities, Sectors and Stocks.
Observations:
- Ah….the slow pause before that early fall/September dreaded negative seasonality. Enjoy the wind on your backs for now as rough sledding is just around the corner!
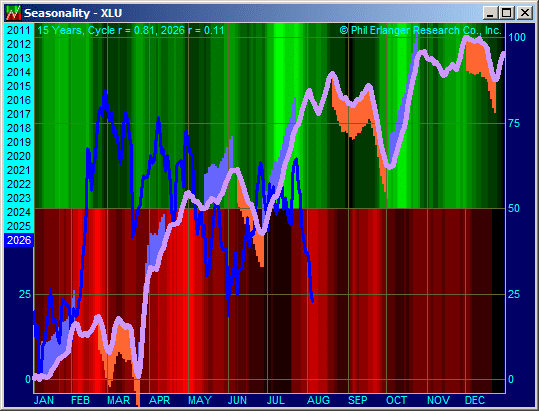
- XLU starts some negative seasonality mid-August
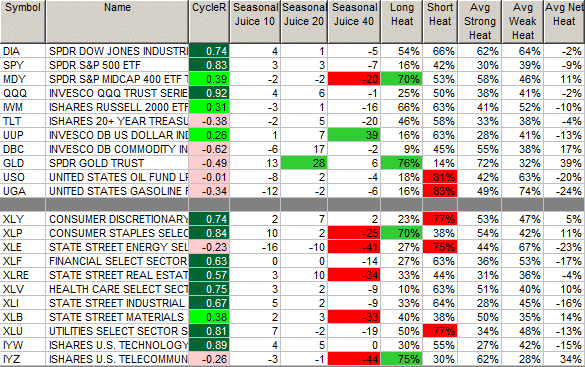
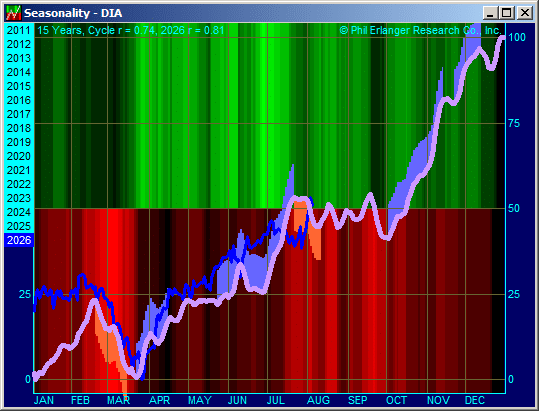
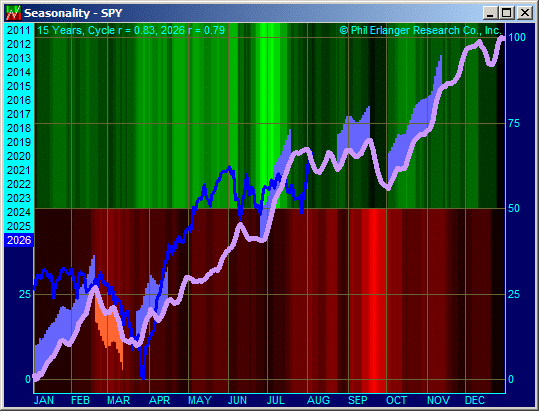
Major Index ETFs: DIA, SPY, MDY, QQQ, IWM
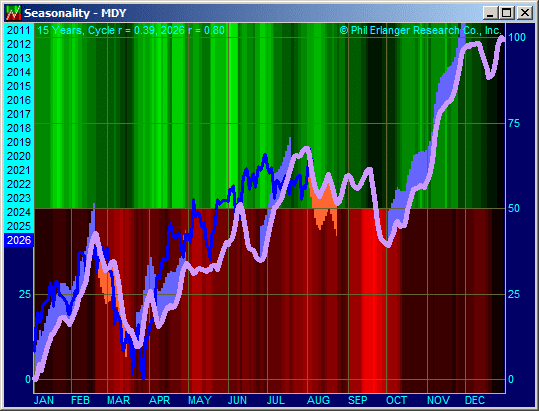
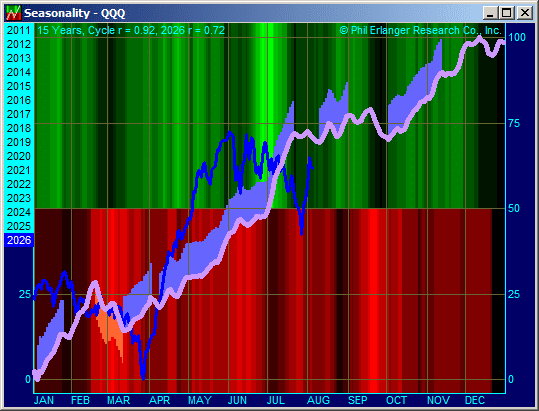
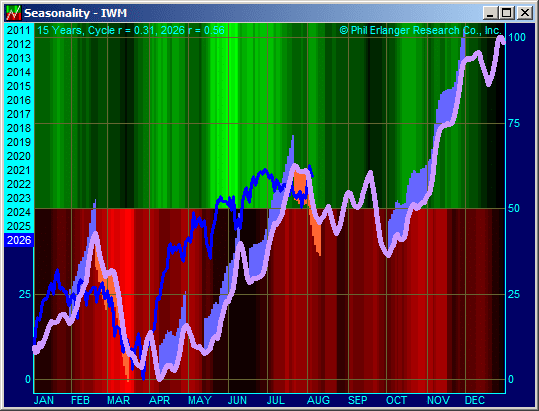
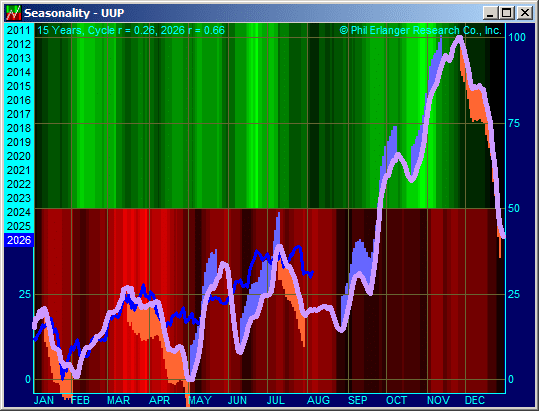
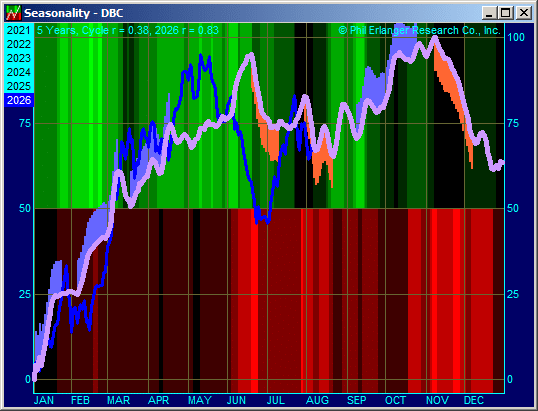
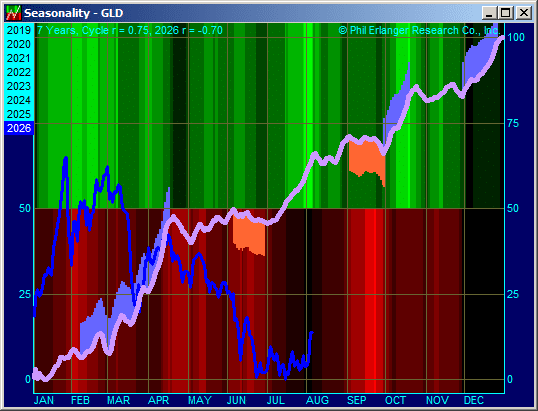
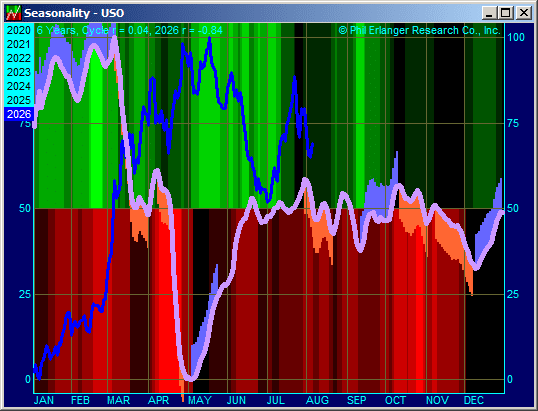
Fixed Income and Commodity ETFs: TLT (optimized), UUP, DBC (optimized), GLD (optimized), USO (optimized), UGA (optimized)
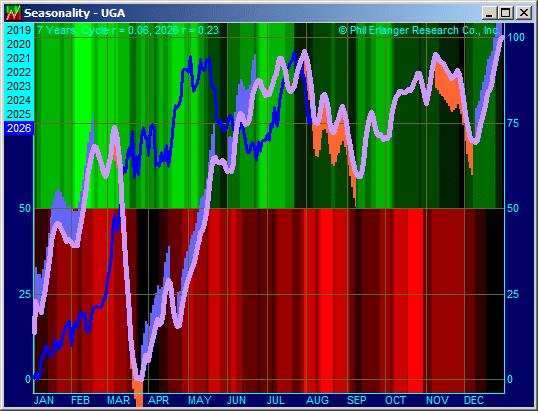
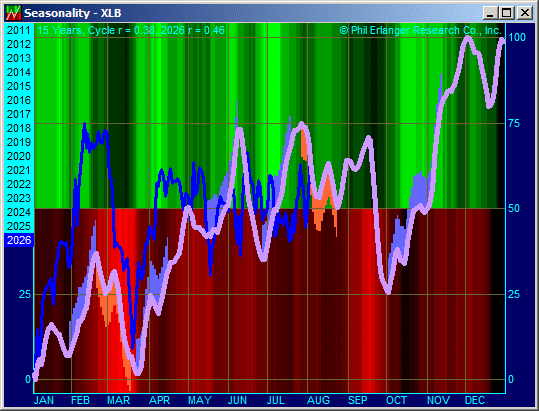
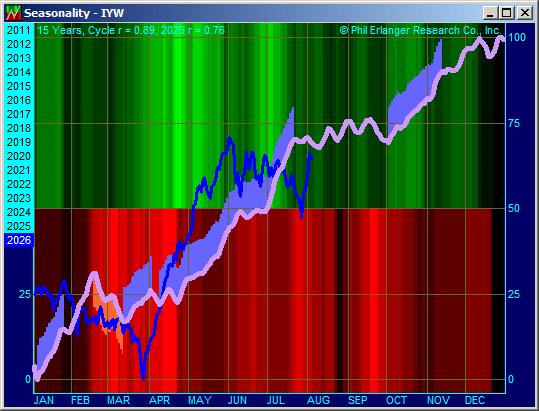
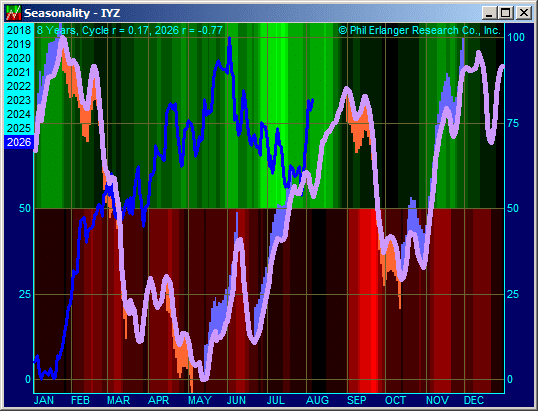
Sector ETFs: XLY, XLP, XLE (optimized), XLF, XLRE, XLV, XLI, XLB, XLU, IYW, IYZ (optimized)
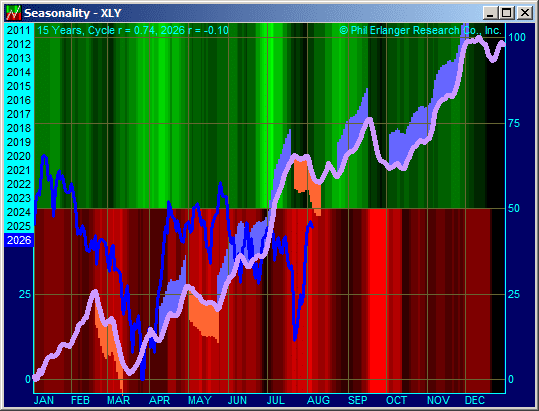
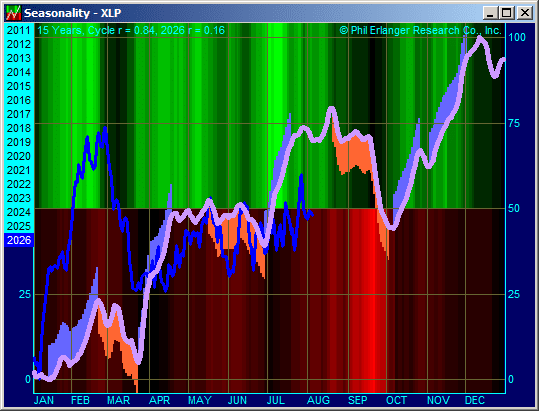
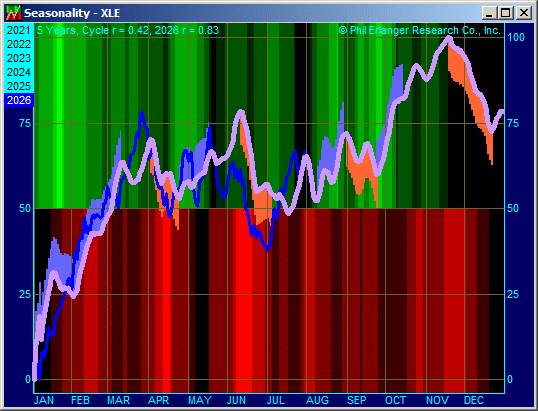
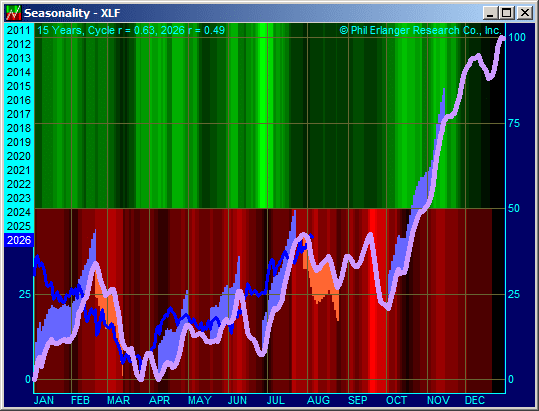
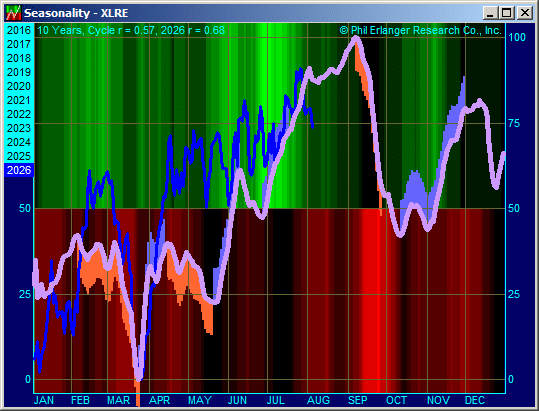
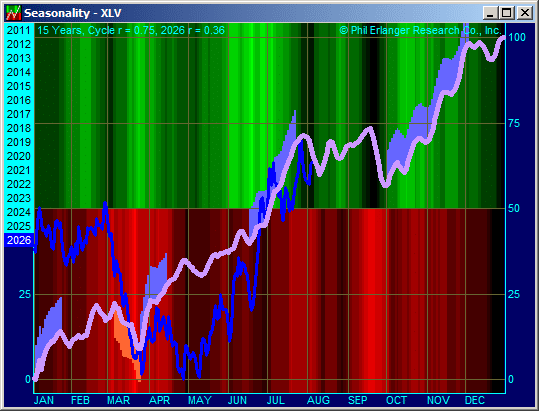
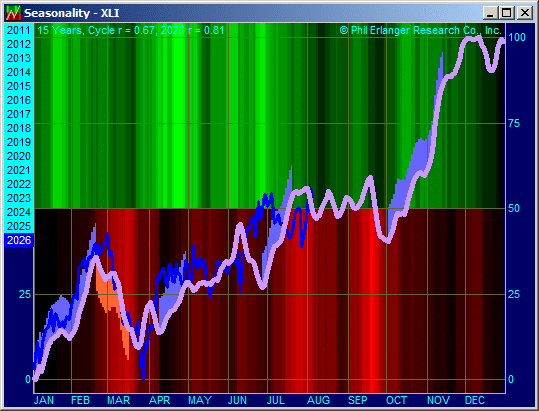
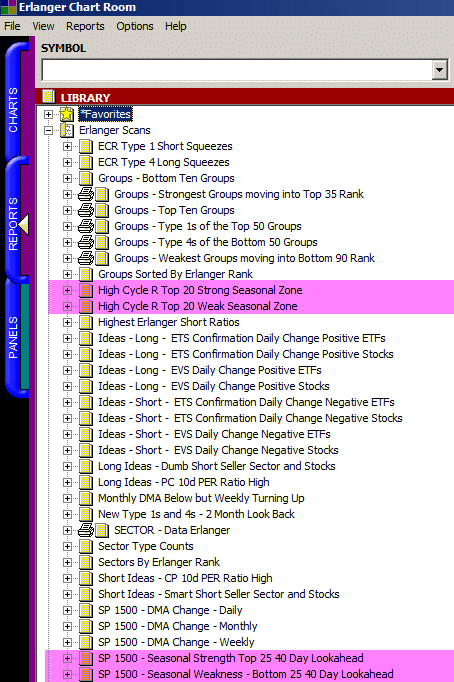
Location of Erlanger Chartroom Software Library Screens for Seasonal Ideas. Updated Daily.
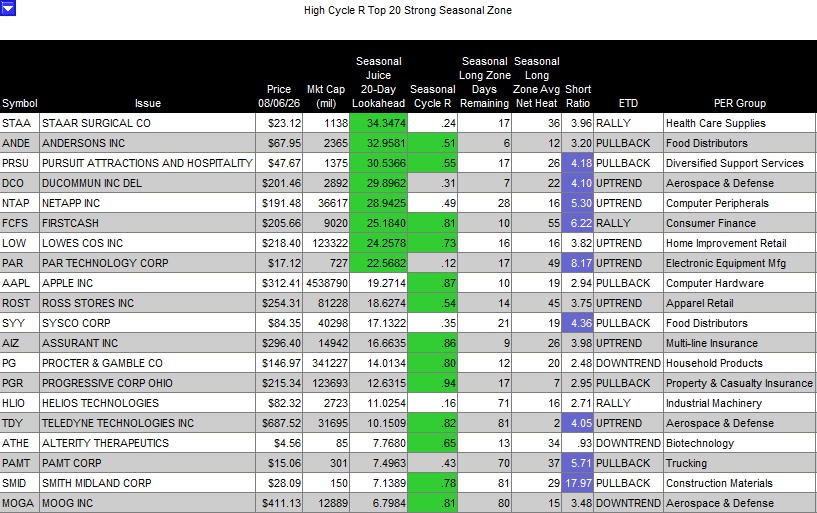
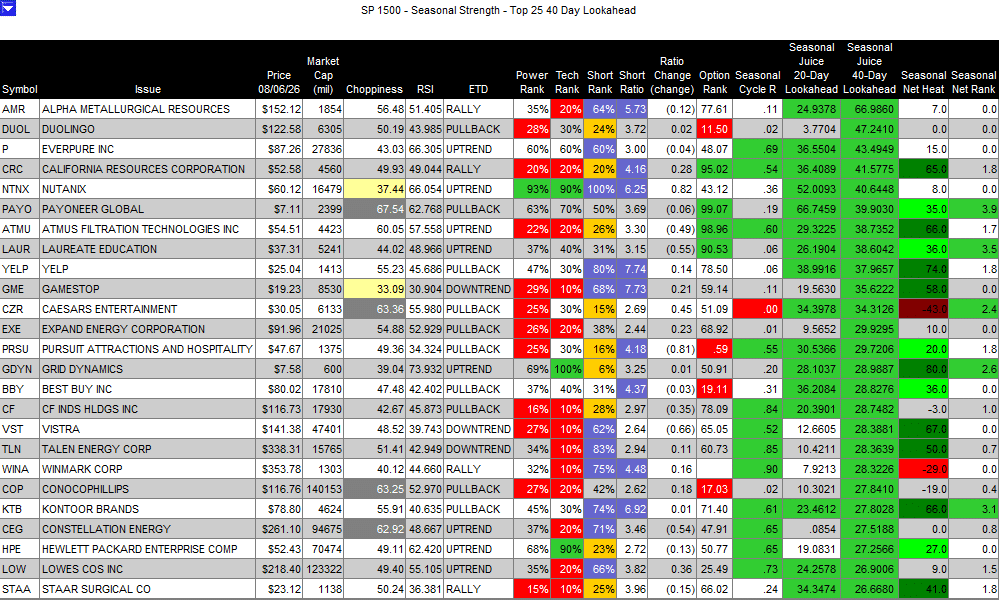
Positive Seasonal Screens from Erlanger Chartroom Library Reports:
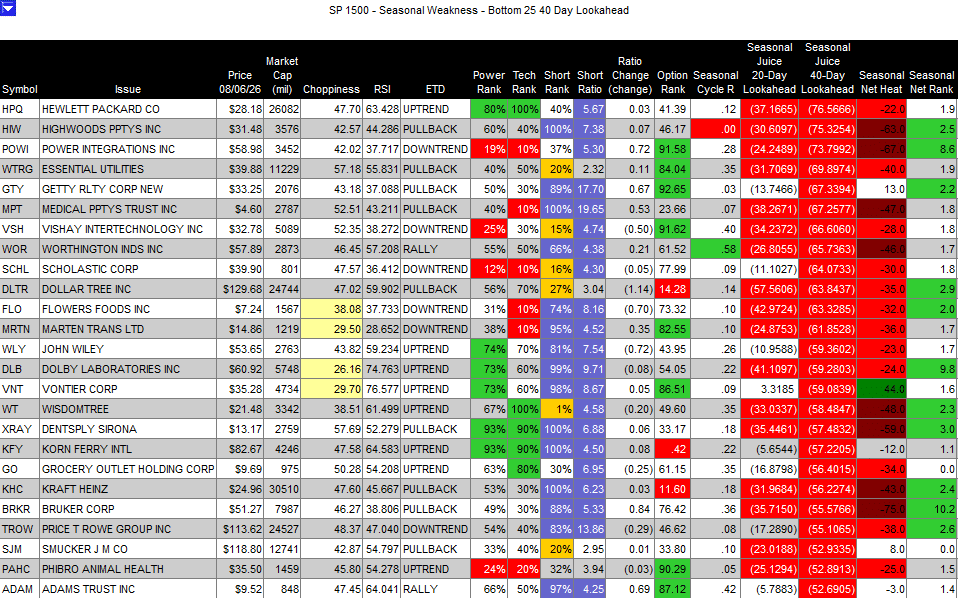
Negative Seasonal Screens from Erlanger Chartroom Library Reports:
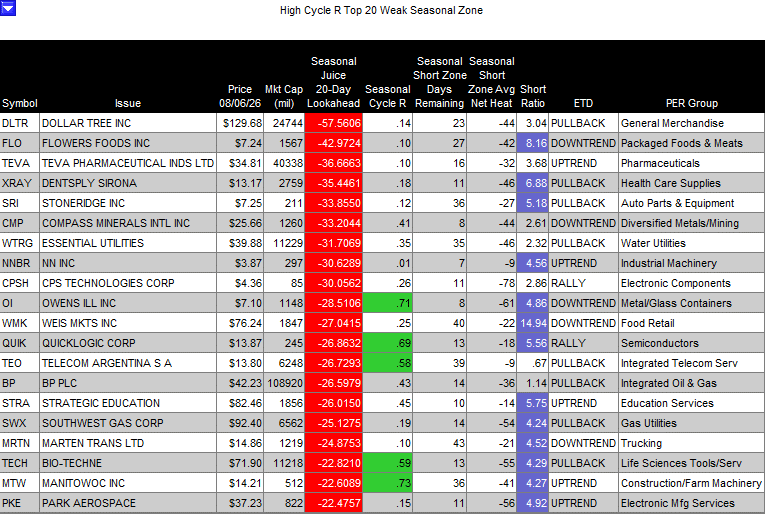
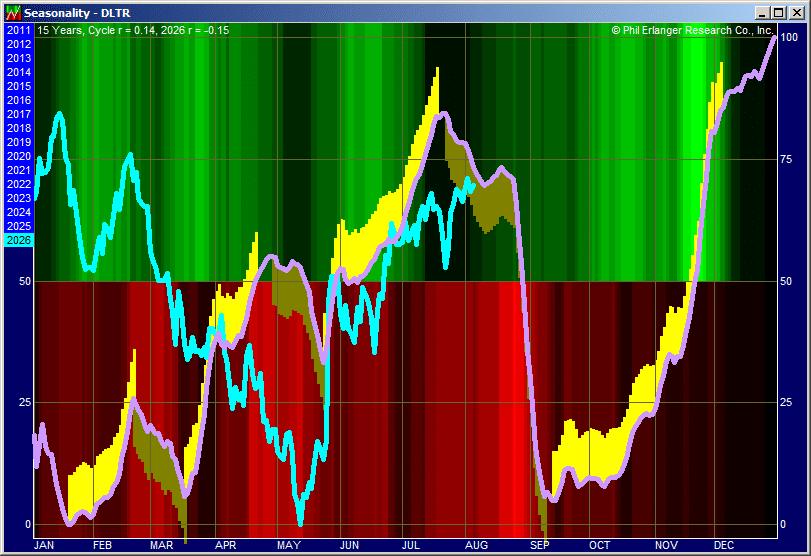
I am highlighting DLTR here as the seasonal chart caught my attention. DLTR reports earnings in the end of August – est. 8/27. When you get a seasonal pattern that looks like this, my earnings flag goes up. Seems DLTR stumbles on reporting 2q earnings every year and are walking back their full year guidance. Something to put on your radar screen and grab some popcorn – Jack