Announcement
The Week Ahead For August 17th-21st: Housing Data and Economic Data Along with Big Box Retailers Lead Earnings
The Week Ahead Starting August 17, 2026 The major stock indexes were higher across the board with the exception of the Dow Jones Industrial Average. The S&P 500 is now in a range of 7800 to 7700 the same as last week. The S&P 500 closed Friday at 7785.76 from 7757.64 on 8/7. Most equity indexes…
The major stock indexes were higher across the board with the exception of the Dow Jones Industrial Average. The S&P 500 is now in a range of 7800 to 7700 the same as last week. The S&P 500 closed Friday at 7785.76 from 7757.64 on 8/7. Most equity indexes we track are above their Daily DMA Channels and in their Weeklies while still above the Monthlies. The Dow Jones Industrial Average 14-day Choppiness index is at 35 from 39 last week and the Russell 2000 is at 41 from 52. This week the S&P 500 is now at 30 from 38 while the NASDAQ 100 is at 35 from 43. Last, the S&P 400 is at 36 from 49.
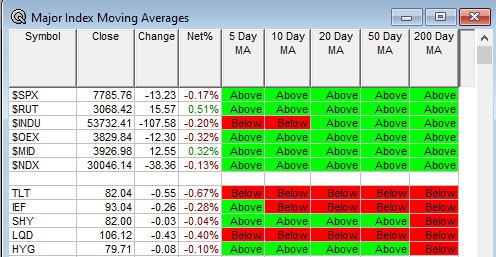
Below is our summary of the Current Moving Average Levels on our index tracking. There is strong action on the equity side and weak action on the bond side.
Moving Averages (updated through 8/14 Close)

The top four areas facing the market in this trading week are:
- Geopolitical and Fiscal Events. Watch our X (Twitter) feed Bullet86 for a last minute heads up on Federal Reserve speakers as well as Treasury auctions each day. Fed Speakers are now out of the blackout period until September 5th as the next FOMC meeting begins on the 15th.
- Economic Releases. Monthly Releases of note this week include Empire State Manufacturing, NAHB Housing Market Index, Housing Starts, Industrial Production, Pending Home Sales, Philadelphia Fed Index, Leading Economic Index, Global U.S. Manufacturing PMI and Global U.S. Services PMI.
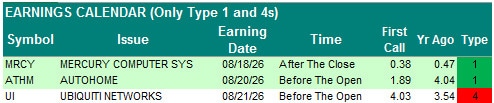
- Earnings Releases. Nothing notable in releases this upcoming week: Earnings season has basically concluded for the first quarter earnings. Second Quarter Earnings will continue this week led by FN XP HD BIDU ADI TJX WMT BABA UI BKE.
- Latest Short Interest Release – The NYSE and NASDAQ released their latest short interest data last week for the collection period of July 15th to July 30th. NYSE Short Interest fell by -2.20% and NASDAQ fell by -1.33%. The S&P 500 fell by -1.09% during the last reporting period. The next release date will be August 25th after the close and ranges from July 30th to August 15th. In that period, the S&P 500 has risen by 3.95%.
Daily Alerts
- August Empire Manufacturing is out at 8:30 a.m. EDT and are expected to fall to 11 from 15.6.
- August NAHB Housing Market index is out at 10:00 a.m. EDT and expected to stay at 34.
- July Housing Starts is due out at 8:30 a.m. EDT and expected to fall to 1,360,000 from 1,427,000.
- July Industrial Production is due out at 10:00 a.m. EDT and expected to rise to 0.30% from 0.10%.
- None of note.
- August Philadelphia Fed Index is due out at 8:30 a.m. EDT and expected to fall to 25 from 41.40.
- July Leading Economic Index is due out at 10:00 a.m. EDT and expected to rise to -0.10% from -0.20%.
- July Global U.S. Manufacturing PMI is due out at 9:45 a.m. EDT and came in last month at 53.90.
- July Global U.S. Services PMI is due out at 9:45 a.m. EDT and came in last month at 54.60.