Announcement
Weekly Report For 8/14/26: Rut Ruhh, trouble ahead for AIQ as opposed to trouble ending?
QUICK COMMENT: The S&P 500 closed at 7785.76 on Friday, 8/14 from 7411.98 at our last update on 7/24. 7700 is now support and 7800 is now resistance. The theme remains of “… would look to buy selective stocks with excess…
By Geoff Garbacz | Market Rebellion · August 17, 2026
QUICK COMMENT: The S&P 500 closed at 7785.76 on Friday, 8/14 from 7411.98 at our last update on 7/24.
7700 is now support and 7800 is now resistance.
The theme remains of “… would look to buy selective stocks with excess puts that are at a base not extended”. There are still tons of stocks that are basing as 50.99% of stocks are now up for the year through July 24th.
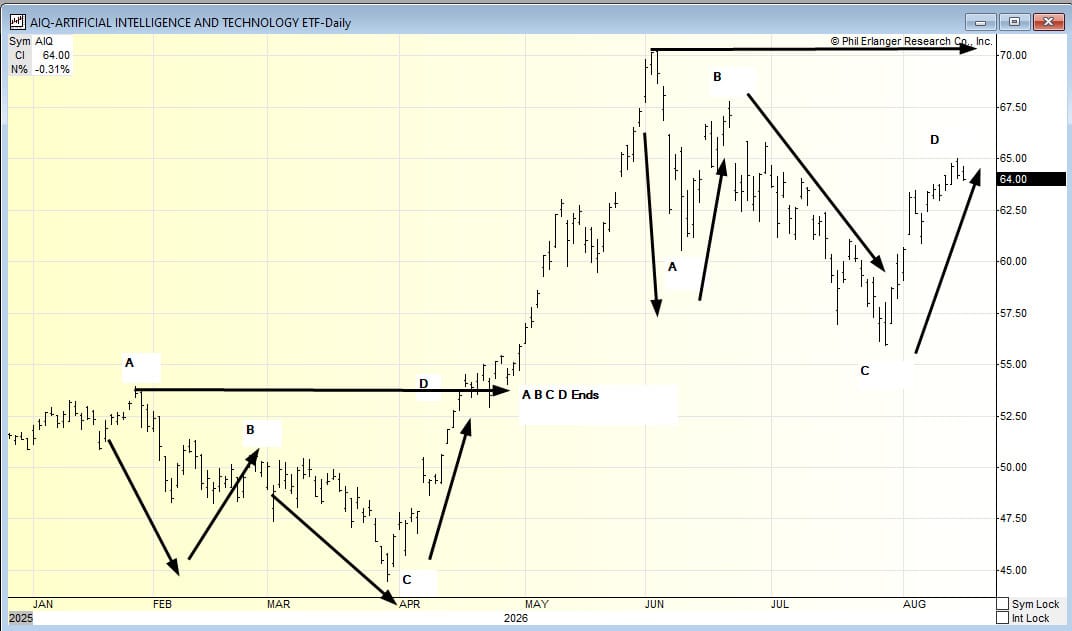
Chart of Interest: AIQ has had 2 A B C D formations this year. The $64,000 does the current one evolve into A B C D E F or worse?
Week Ended 7/24: VIX Positive Seasonality has started which means stocks are vulnerable in the S&P 500. Yet to materialize.
Week Ended 7/17: We reviewed the holdings of stocks in the ETF, AIQ. Clearly, many of the stocks are in trouble and we need to see improvement for a new run in AI stocks.
Week Ended 7/10: We showed a combined chart of RSI and Choppiness which is high indicating a new move is on its way..
Stats of Note: The S&P 500 has made 37 new highs in 2025. There have been 28 new highs for 2026 with the last one on August 12th.
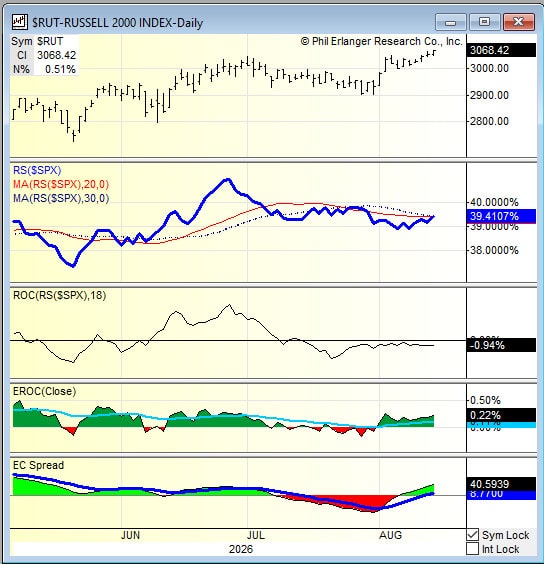
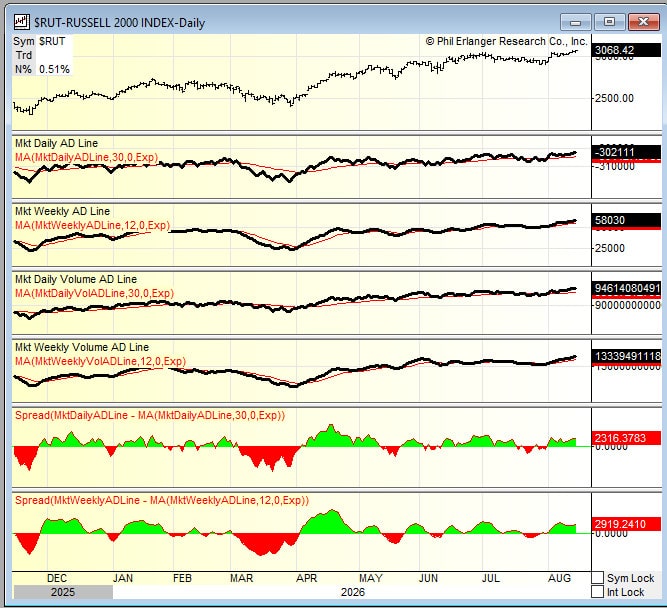
MACRO CHART of S&P 500 VERSUS RUSSELL 2000: The Russell 2000 is now tracking the S&P 500 (30 Day Moving Average (red line)) There is also in the Chart a 20 day moving average)
IND RSI Overbought/Oversold – 0 Sectors are overbought and 0 oversold.
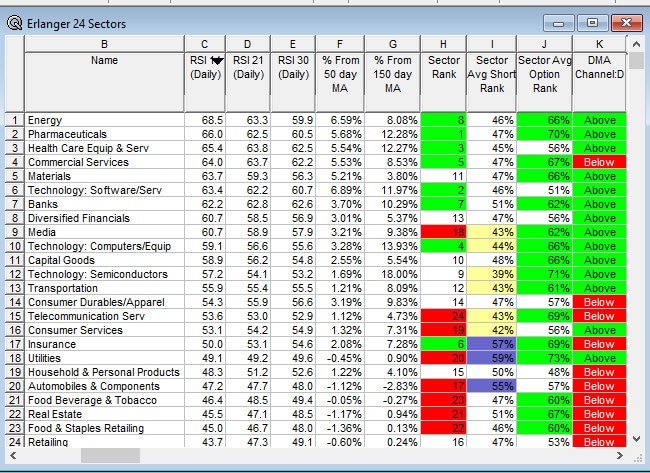
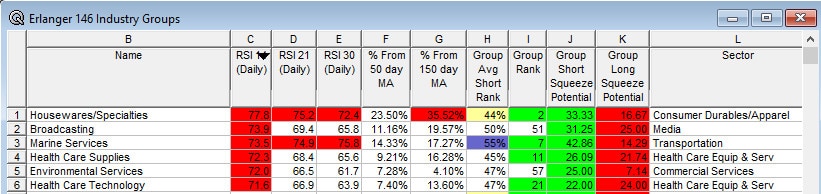
Groups: 6 Groups Are Overbought & 0 Groups are Oversold:

MARKET BREADTH: The chart below is of the Market Breadth with Daily & Weekly A/D Lines as well as Daily & Weekly Volume A/D Lines. Breadth is no longer a problem as it has been gaining strength.
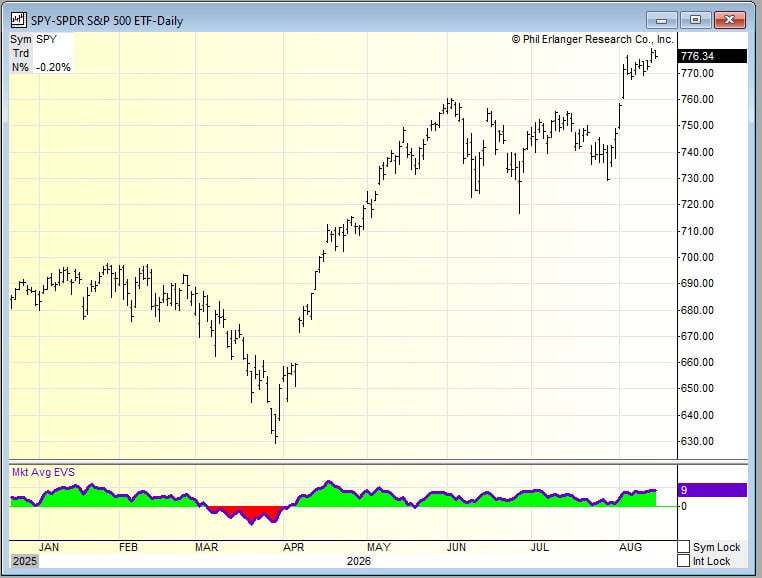
MARKET EVS: Market Erlanger Volume Swing (EVSM) is at 9.
BIAS/Setup And Trigger Tables – Green is positive. Yellow is neutral. Red is negative.
Bias
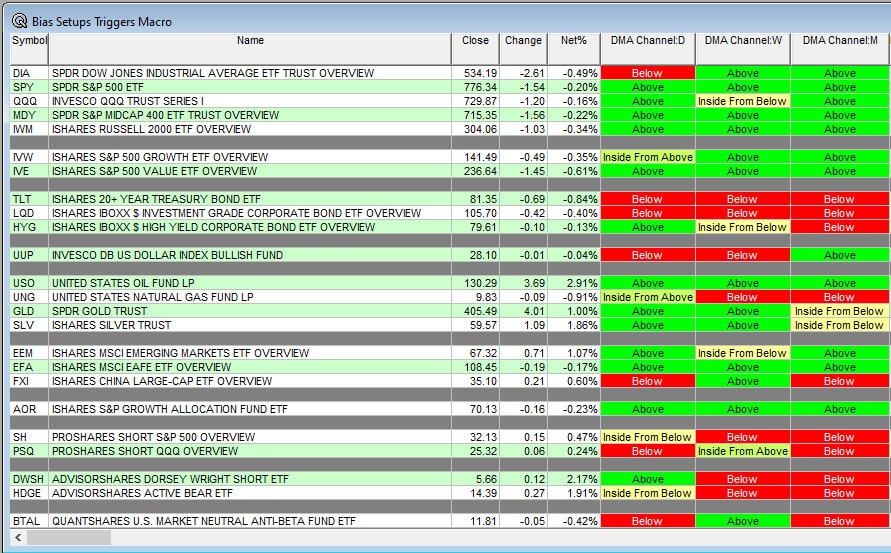
Triggers
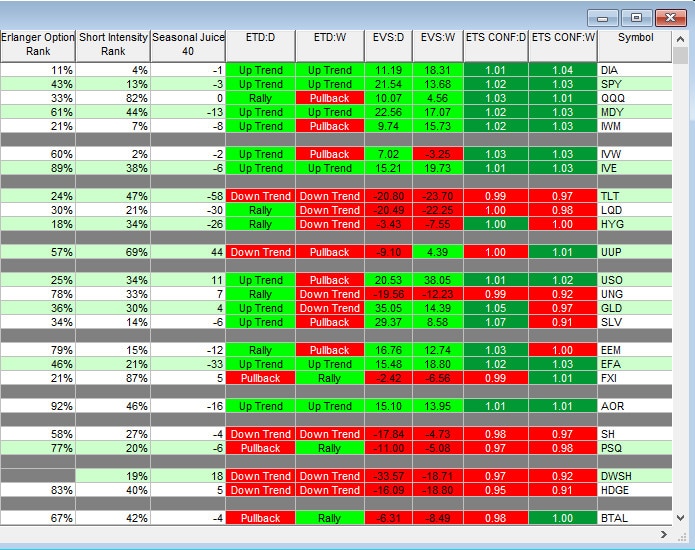
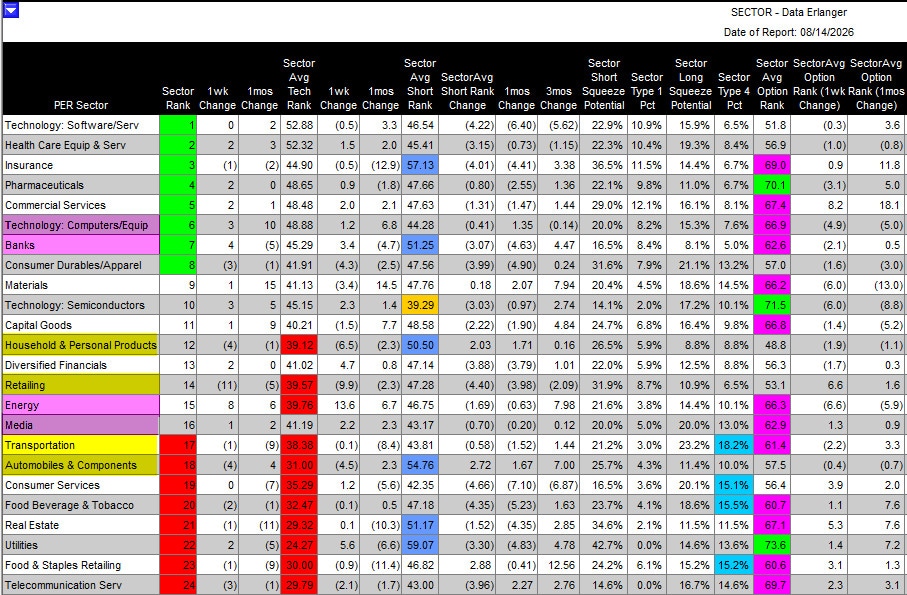
I. Sector changes this week. This was a “moderate rotation” week as one sector moved to buy and one moved to sell. In ECR, look for Sector Data Erlanger.
(+) New moves to Buy: Technology: Computers/Equip and Banks of note.
Most Interesting Jump of the Week: Banks of note.
(- ) New moves into Avoid: Transportation & Automobiles And Components
Most Interesting Drop of the Week: Transportations