Announcement
Weekly Report For Week Ended 7/24: VIX Seasonality Bad For Stocks. Will it Break Out?
QUICK COMMENT: The S&P 500 closed at 7411.98 on Friday from 7457.69 at our last update on 7/17. 7400 is now support from 7500 and 7500 is now resistance from 7600. The theme remains of “… would look to…
By Geoff Garbacz | Market Rebellion · July 26, 2026
QUICK COMMENT: The S&P 500 closed at 7411.98 on Friday from 7457.69 at our last update on 7/17.
7400 is now support from 7500 and 7500 is now resistance from 7600.
The theme remains of “… would look to buy selective stocks with excess puts that are at a base not extended”. There are still many stocks that are basing as 50.99% from 52.90% of stocks are now up for the year through July 24th.
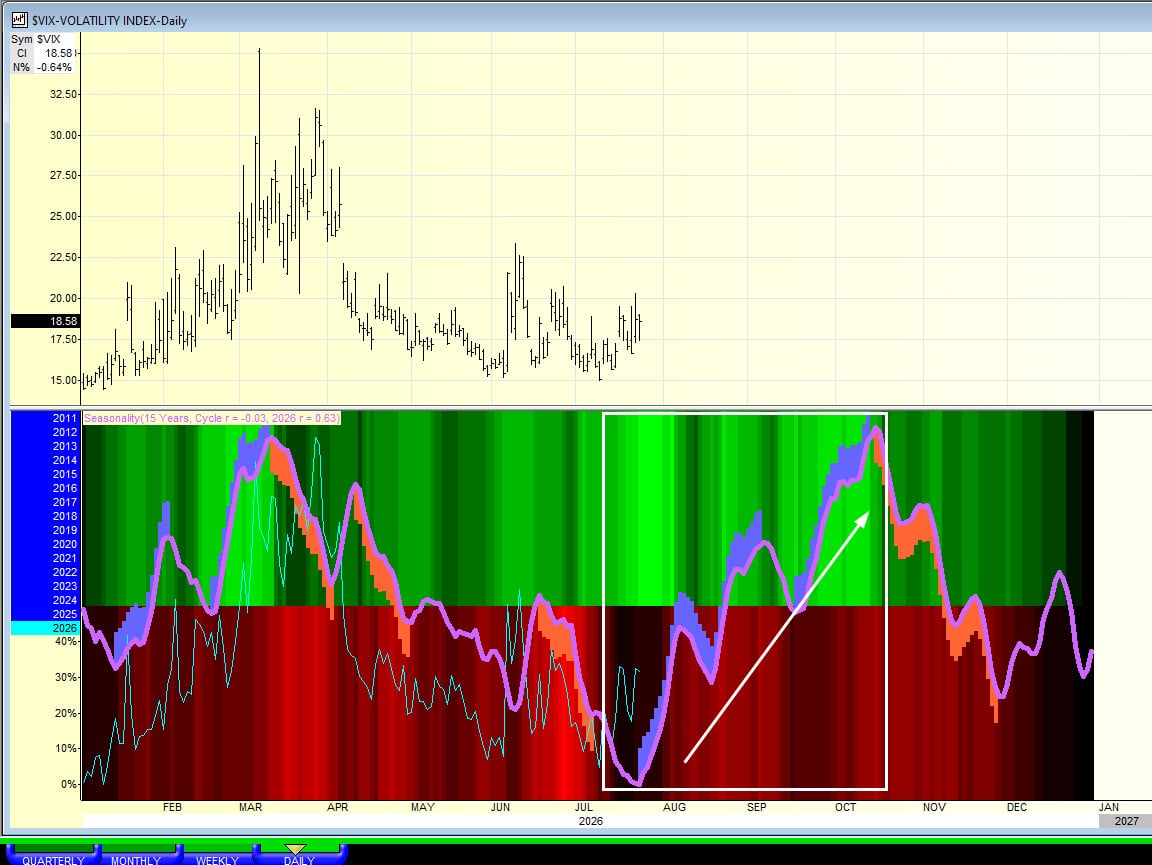
Chart of Interest: VIX Positive Seasonality has started which means stocks are vulnerable in the S&P 500.
Week Ended 7/17: We reviewed the holdings of stocks in the ETF, AIQ. Clearly, many of the stocks are in trouble and we need to see improvement for a new run in AI stocks.
Week Ended 7/10: We showed a combined chart of RSI and Choppiness which is high indicating a new move is on its way.
Week Ended 6/26: The combined chart of short interest. It is getting very extreme. Shorts are not shy about establishing positions.
Stats of Note: The S&P 500 has made 37 new highs in 2025. There have been 25 new highs for 2026 with the last one in June, on the 2nd, with none in July.
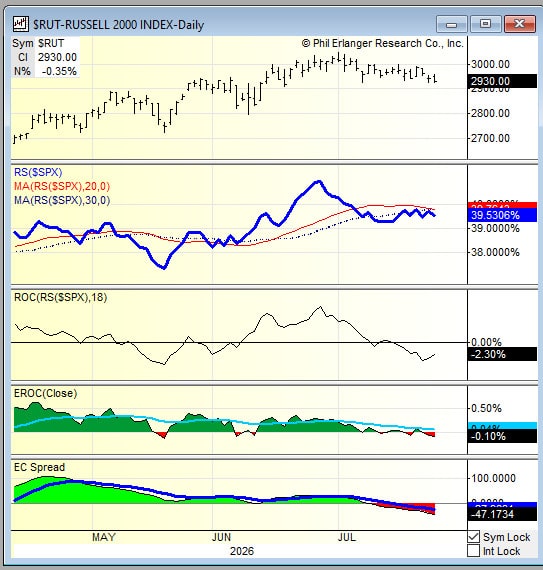
MACRO CHART of S&P 500 VERSUS RUSSELL 2000: The Russell 2000 is still lagging the S&P 500 (30 Day Moving Average (red line)) There is also in the Chart a 20 day moving average)
IND RSI Overbought/Oversold – No Sectors are overbought or oversold.
Groups: 0 Groups Are Overbought & 1 Group is Oversold:

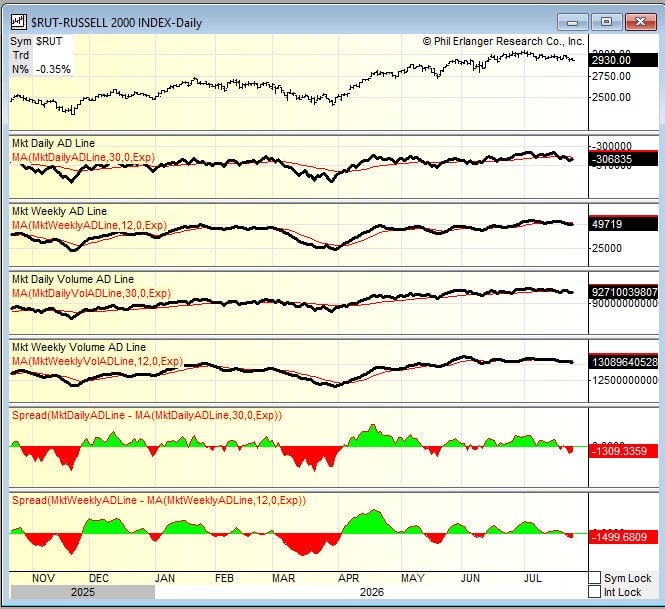
MARKET BREADTH: The chart below is of the Market Breadth with Daily & Weekly A/D Lines as well as Daily & Weekly Volume A/D Lines. Breadth is now a problem as it rolled over this week.
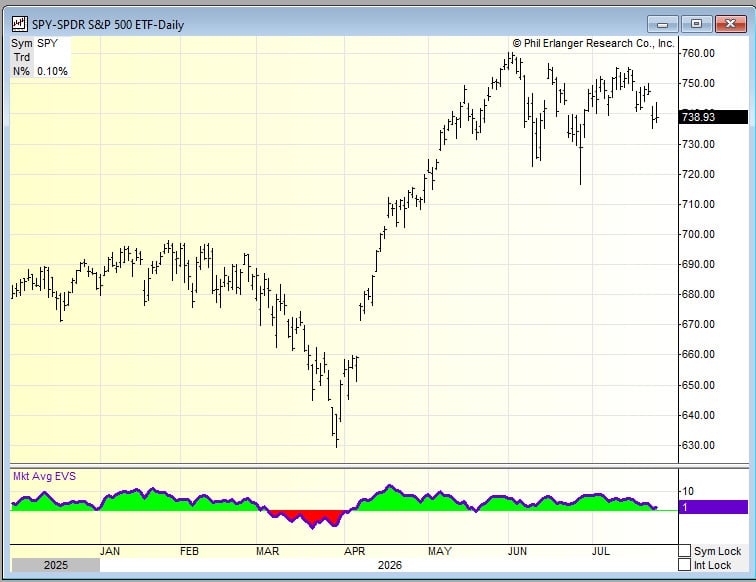
MARKET EVS: Market Erlanger Volume Swing (EVSM) moves from 5 this past week to 1.
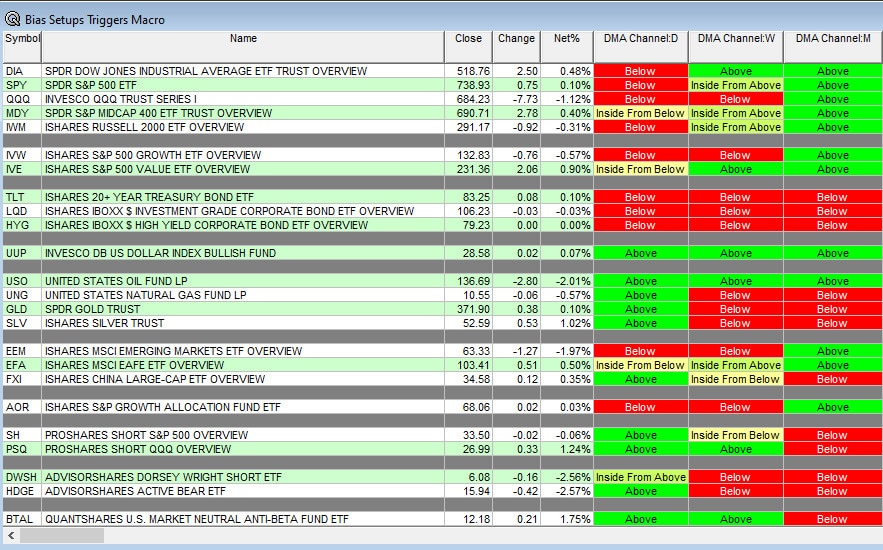
BIAS/Setup And Trigger Tables – Green is positive. Yellow is neutral. Red is negative.
Bias
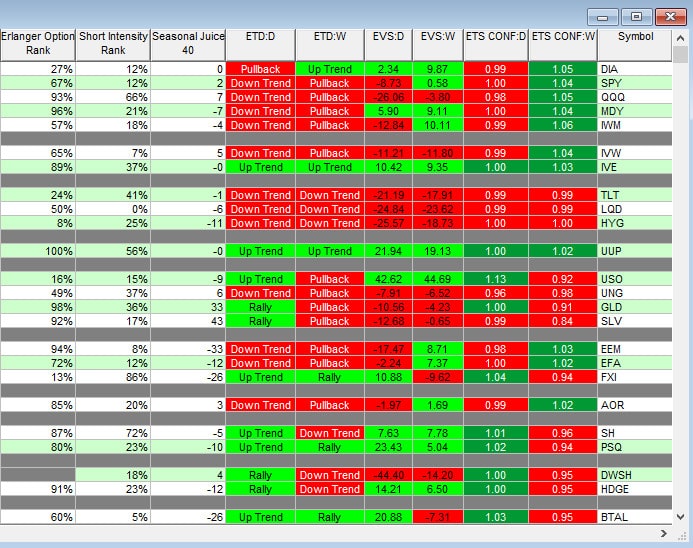
Triggers
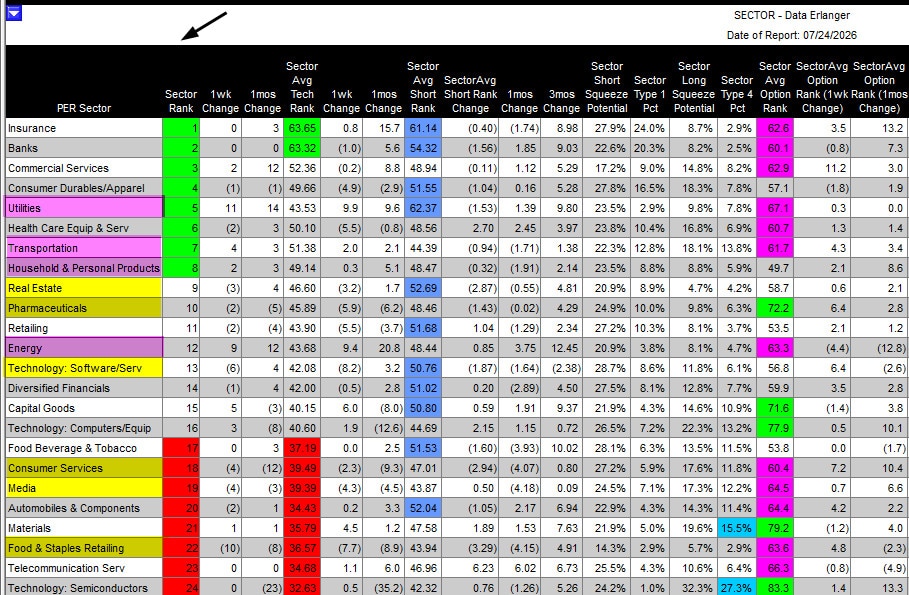
I. Sector changes this week. This was a “light rotation” week as one sector moved to buy and one moved to sell. In ECR, look for Sector Data Erlanger.
(+) New moves to Buy: Utilities, Transportation and Household & Personal Products of note.
Most Interesting Jump of the Week: Transportation of note.
(- ) New moves into Avoid: Consumer Services, Media and Food & Staples Retailing
Most Interesting Drop of the Week: Consumer Services