
Cryptocurrency
On-Chain Volume Indicates Bitcoin has Likely Bottomed
Short-Term View On the daily chart above, Bitcoin is in the middle of a bullish price flip and is on a green 2 candle. Therefore, sequential is stating that bullish price action is likely to continue in near future. Additionally, the RSI is finally rebounding from profoundly oversold levels. Daily Heikin – Ashi On the […]

Short-Term View
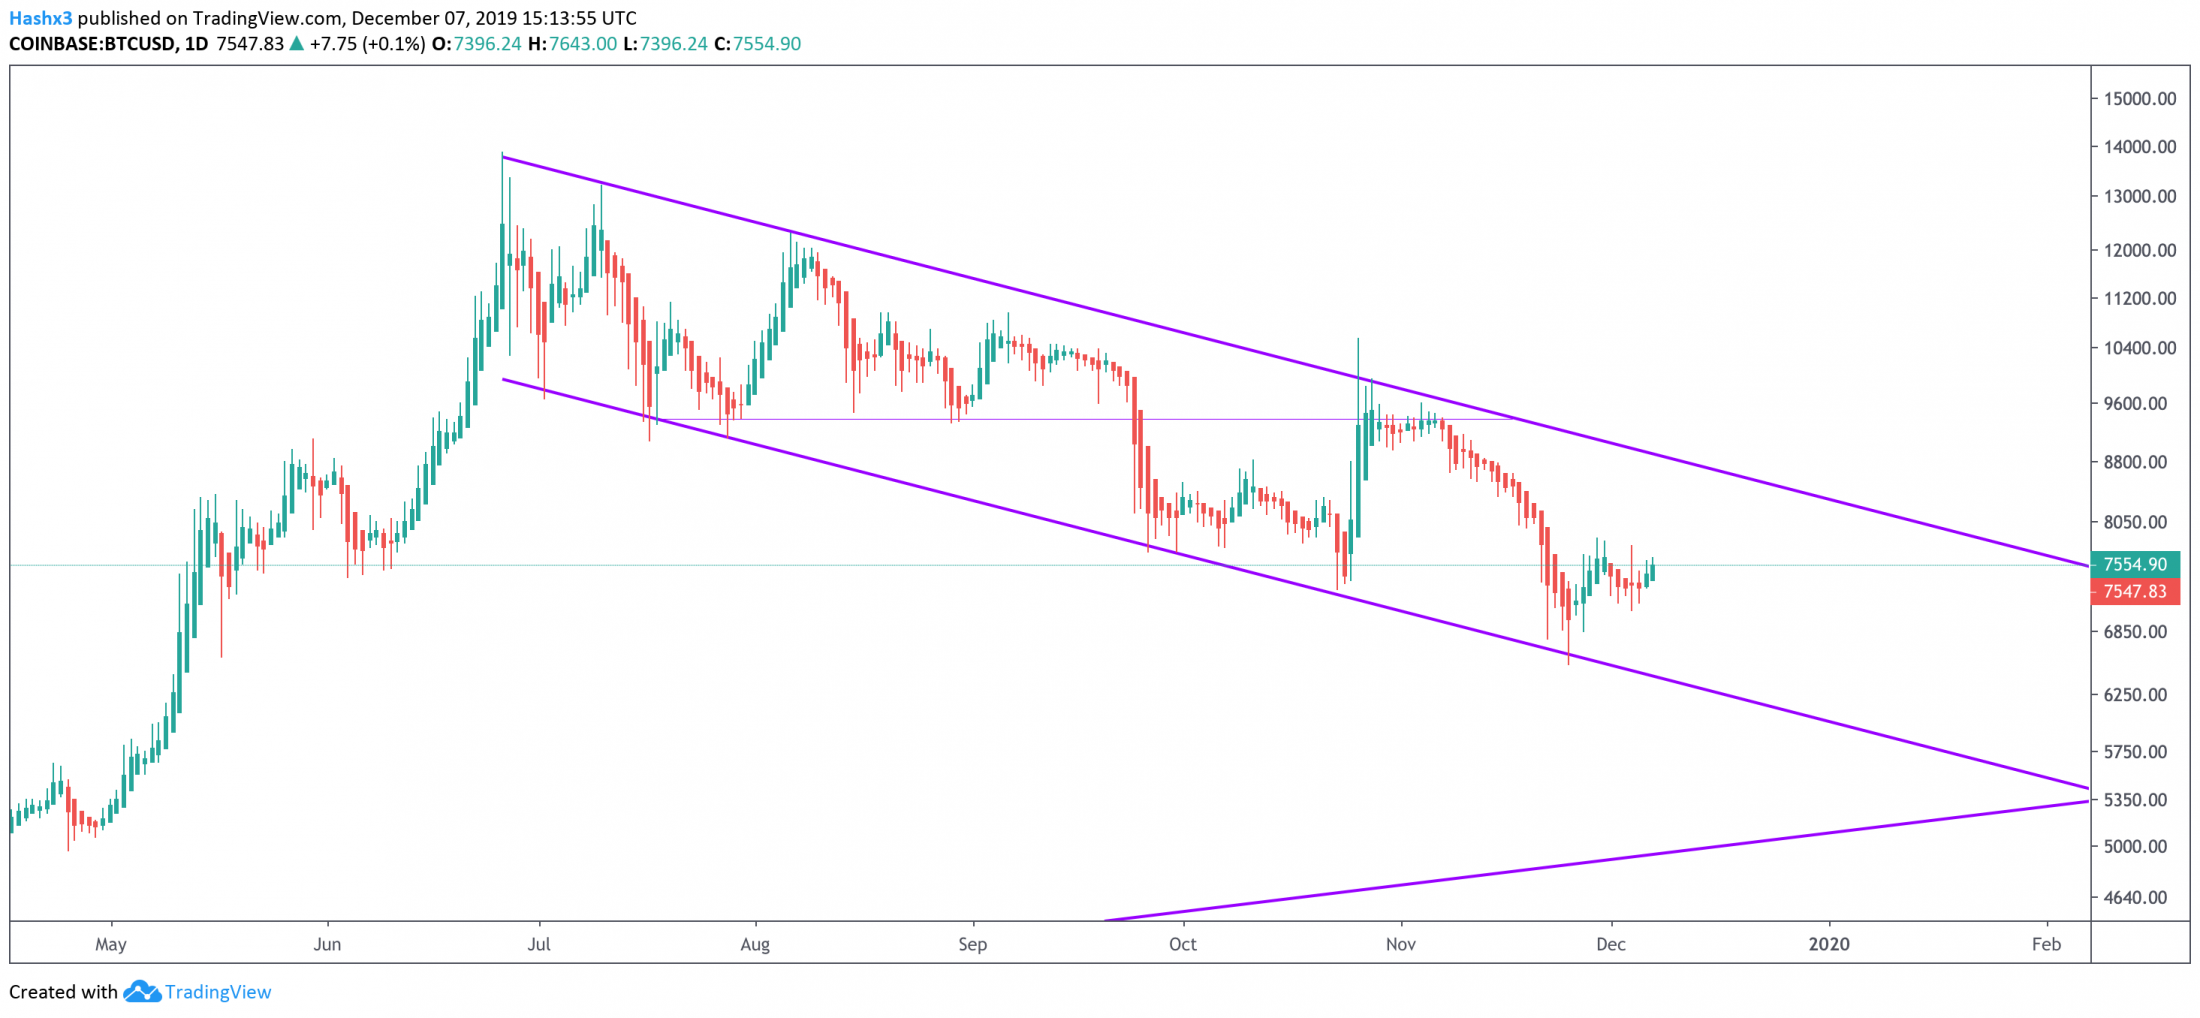
On the daily chart above, Bitcoin is in the middle of a bullish price flip and is on a green 2 candle. Therefore, sequential is stating that bullish price action is likely to continue in near future. Additionally, the RSI is finally rebounding from profoundly oversold levels.
Daily Heikin – Ashi
On the daily chart above, you can see that Bitcoin started a tentative bull flag with the emergence of 2 green heikin ashi candles. We’ll have to continue to monitor bullish price action from the heikin ashi candles, nevertheless, this is a good sign for the beginning of an uptrend.
4 Hour
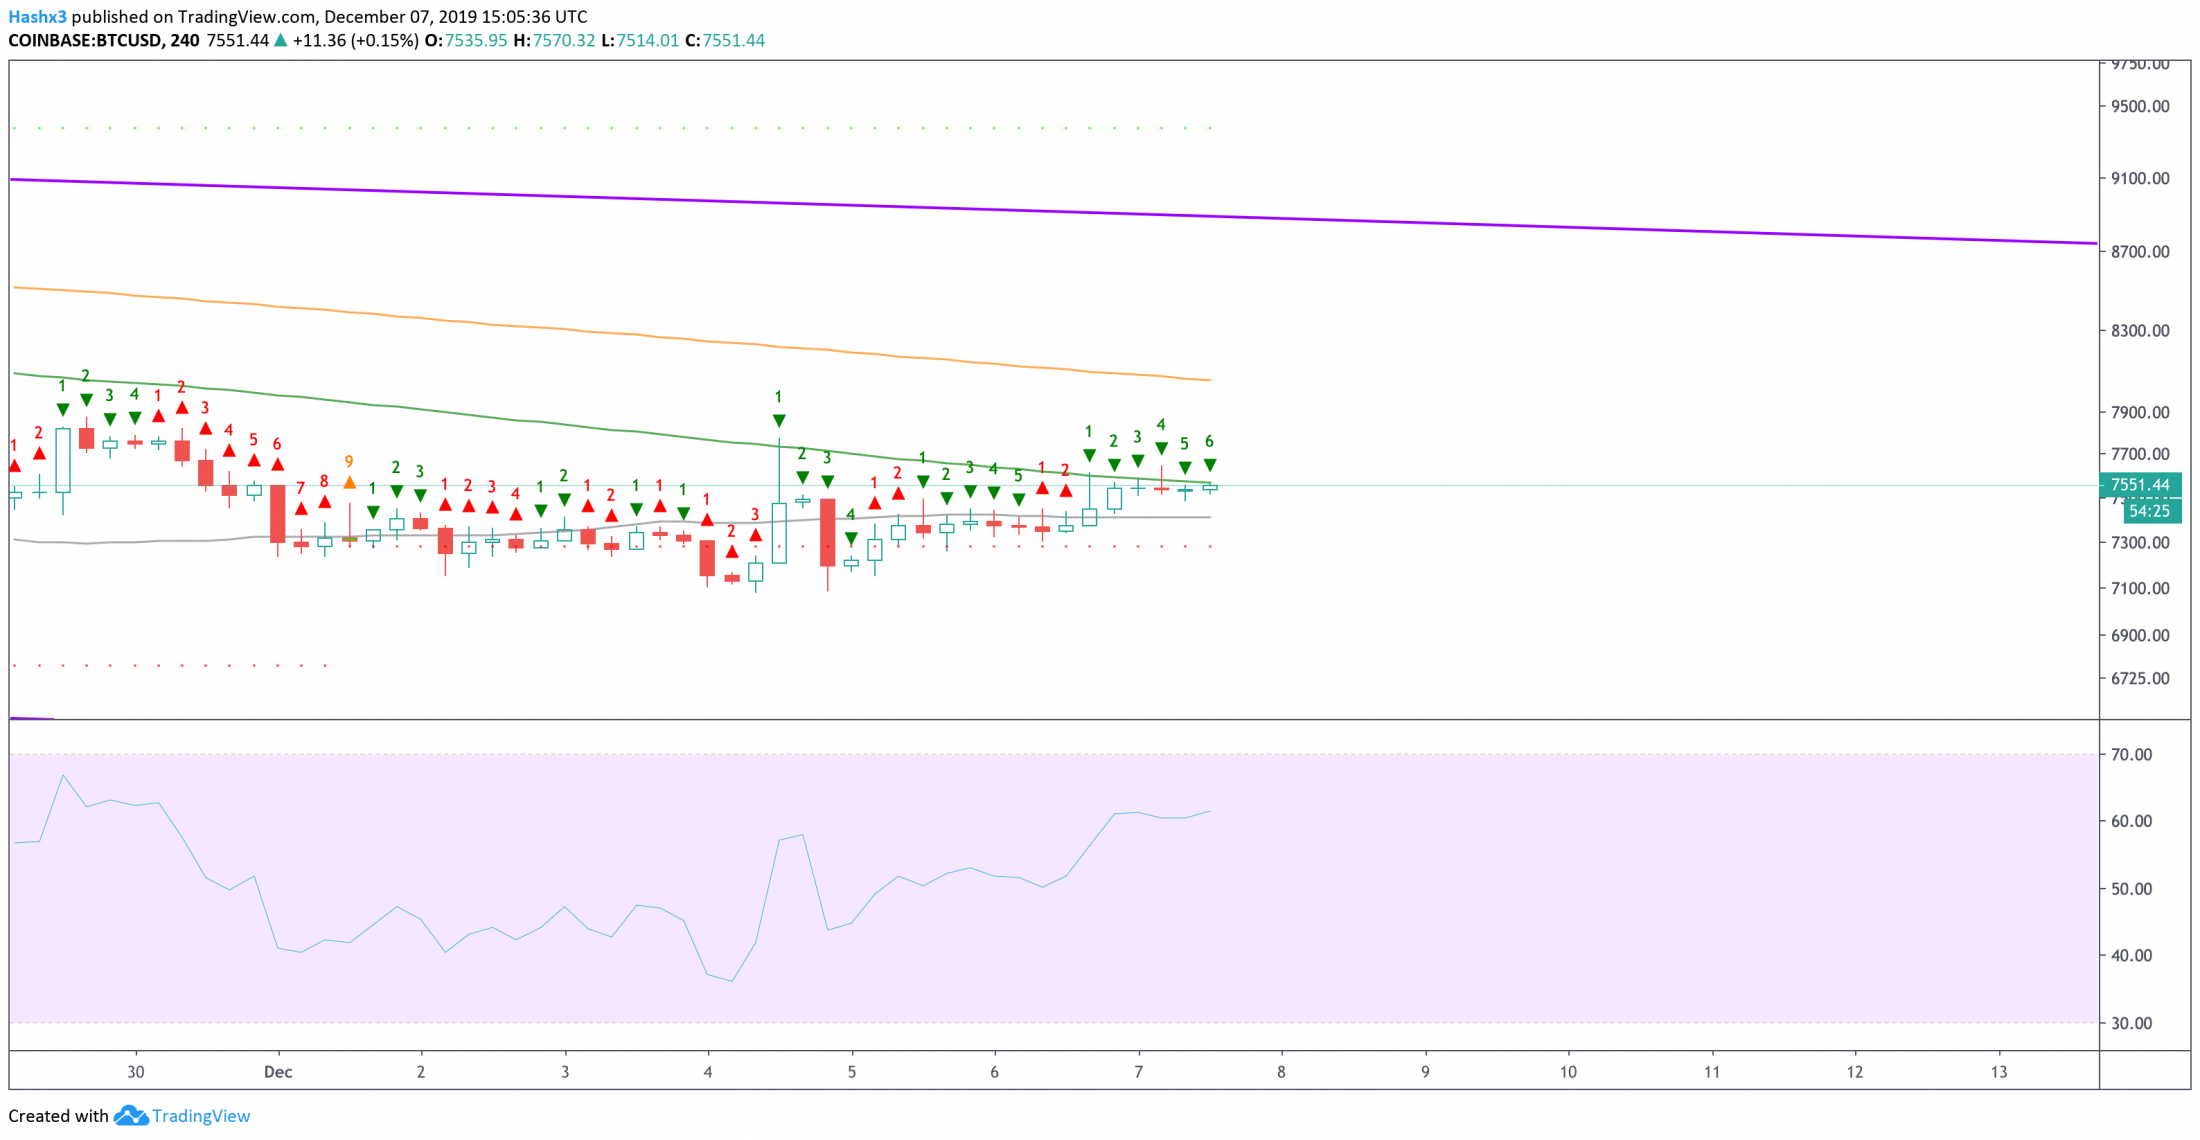
On the 4 hour chart, Bitcoin is on a green 6 of 9 candle and is still trading below the 128MA (green). However, if bullish price action increases, the 50MA (grey) will likely experience a bullish cross over with the 128MA (green). This would be a promising sign in the short term.
On Chain Volume Suggests Bitcoin has Bottomed
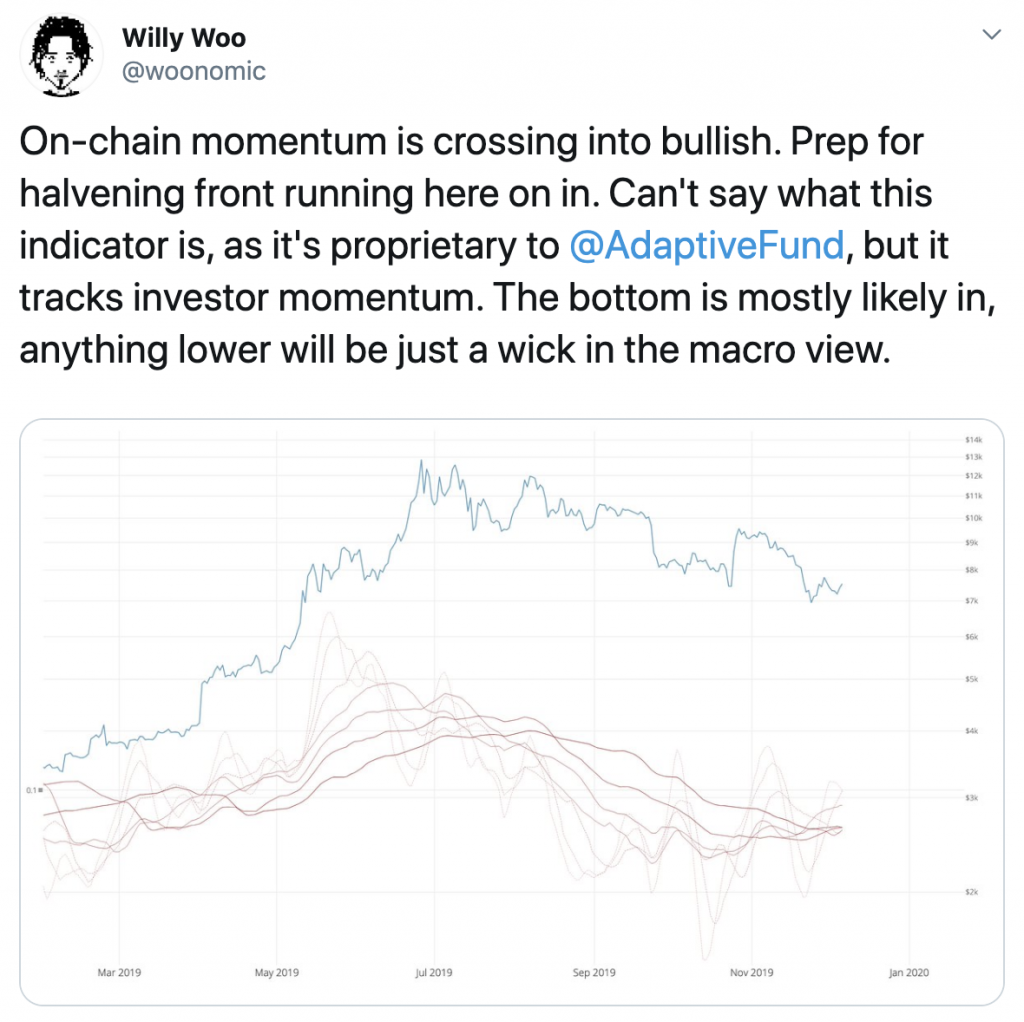
Prominent Bitcoin fundamental analyst, Willy Woo, recently tweeted a chart of investor interest calculated by on-chain metrics. While Woo does not mention the indicator, as it is proprietary, it looks incredibly similar to a few metrics listed on Woo’s website.
WooBull Charts: Difficulty Ribbon
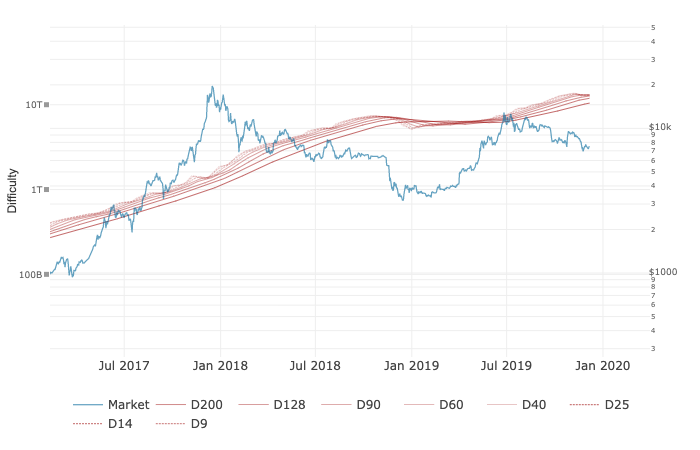
This bottoming hypothesis also coincides with the first intersection of the difficulty ribbon. As you can see on the chart above, the difficulty ribbon first began its bullish crossover when Bitcoin reached a price of $4k and continued to flip as price bottomed at $3.1k. Shortly afterward, Bitcoin rallied all the way to $14k for more than a 200% gain. Now, we are in an oversold region on the macro trend and the difficulty ribbon has experienced its first crossover. Furthermore, this indicator is stating that bullish price action is likely to ensue as we reach closer to the 2020 halvening.
Conclusion
While Bitcoin has been traveling in a downward channel for some time, we are beginning to see some bullish signals. On the 4 hour and daily time frames, Bitcoin is rebounding from oversold levels and is beginning to form support at $7.5k. Still we are ultimately waiting on Bitcoin to break out of the downward price channel before massive bullish price action ensues.
Disclaimer: The author of the article hodls Bitcoin.