
Trading Insights
Pete Najarian Explains The VIX
Volatility is one of the three most important metrics (“the three V’s”) that we reference as options traders. But how can we accurately measure market-wide volatility? Enter: The VIX. The CBOE Volatility Index, often referred to as “the VIX”, is a real-time index that measures the market’s expectations for near-term (30-day) price changes in the […]

Volatility is one of the three most important metrics (“the three V’s”) that we reference as options traders. But how can we accurately measure market-wide volatility? Enter: The VIX.
The CBOE Volatility Index, often referred to as “the VIX”, is a real-time index that measures the market’s expectations for near-term (30-day) price changes in the S&P 500. It’s an important tool for any options trader to understand and analyze.
What is the VIX?
Considered by many to be the best gauge of market sentiment, the VIX can be read as a sort of “Fear-ometer” for stocks, often synonymous with volatility itself.
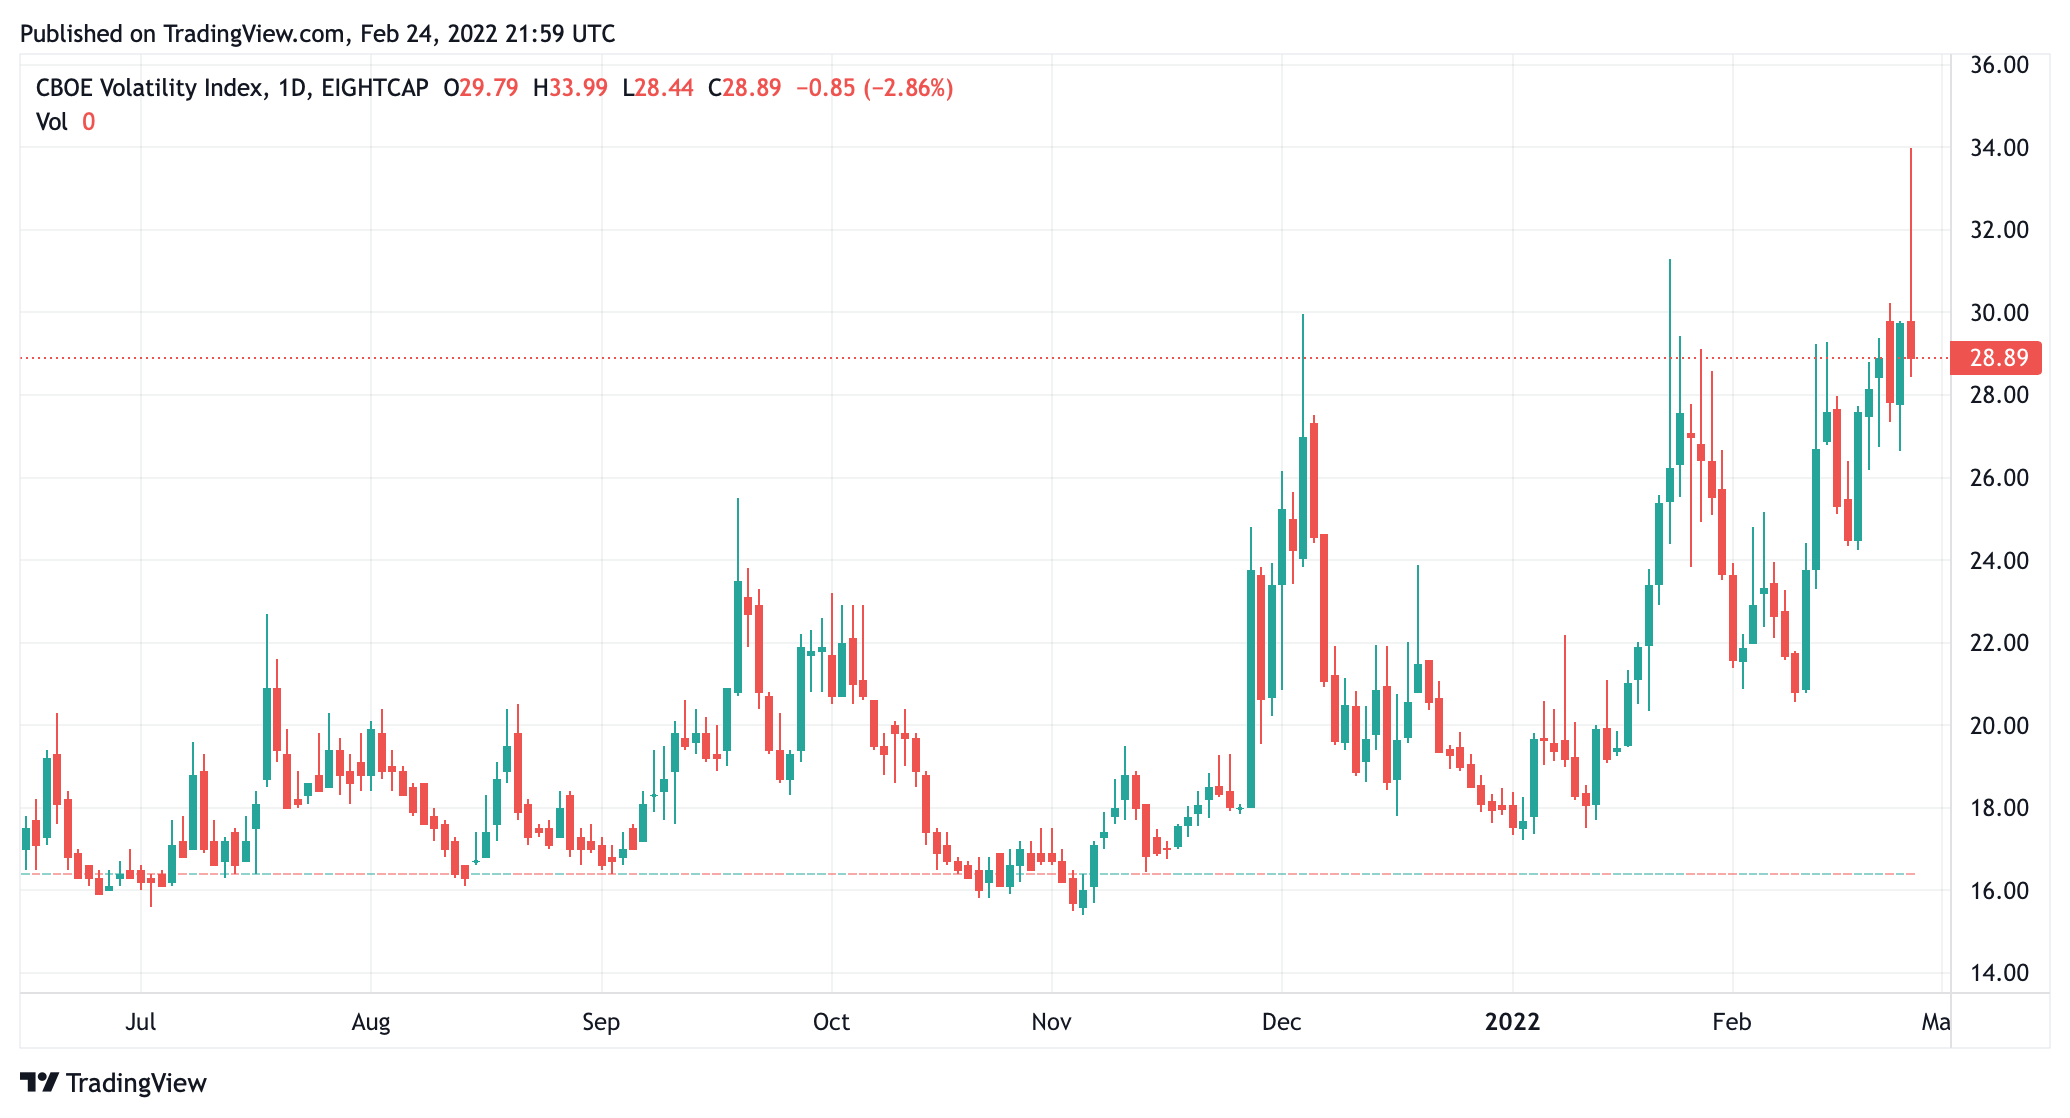
But most traders have only a rudimentary knowledge of what the numbers on the VIX actually represent. They see a VIX of 16 and think, “that’s low, must mean we’re in a low volatility environment”. They see it rise all the way up to 32 and think, “that’s high, must mean we’re in a high volatility environment” But many traders fail to understand past that point what those numbers truly mean.
Market Rebellion Co-Founder Pete Najarian breaks it down clearly in this informative clip from our recent Smart Spreads webinar hosted by Chief Options Strategist Ryan Mastro. In it, Pete explains that people are often critical of him for bringing up volatility on CNBC so frequently — and that those critics just don’t get it.
They don’t understand the importance that the VIX has in predicting the overall landscape of the market. They don’t understand that the VIX is literally a measure of the expected move in the S&P 500. Listen to Pete break down exactly what the various numbers on the VIX gauge actually represent below.
“You have a 16 VIX. That means the S&P has to move 1% per day. Every single day. And so, ‘Is that happening?’ and then you get to 32 — now you have to move 2% every single day.”
Implied Volatility
Pete continued his volatility vindication with an explanation of how the VIX relates to IV, or “implied volatility”, and how investors can use information from both to make smarter trades.
“We look at the volatility index all the time, but we also look at the implied volatilities of individual stocks. When we see that implied volatility get up there, boy does that fit in really well with credit spreads because that’s when you can pounce. That’s when the activity is going to be there for the kind of credit spreads that we’re talking about.”
Listen to Pete break it all down in video form below!
Where do we go from here?
With a VIX that’s hovering around 30 right now, Pete concluded his explanation with a bold, contrarian prediction about where the VIX may be heading next.
“When it starts getting above 30, and you start getting close to 32 or 34, it’s really difficult for the markets to stay at those levels. That’s why, when we look at March 2020 with the pandemic at early stages and everyone freaking out, it got to 85 and boy that didn’t last long.
Even though things were still terrible and getting worse, the VIX dropped. First to 60. And then it was 40. Something people have to understand is that when we get these little moves like we’ve had of late, it’s easy for me to tell you that I don’t think the S&P is going to move 2% every single day. It’s a limited time before we start getting back into the mid-20’s, and before you start blinking, it’s mid-spring, and ‘wow, we’re in the teens already?’”
The bottom line
Pete’s prediction makes a lot of sense. The VIX indicates how large the daily moves in the S&P are expected to be, and 2% is an extraordinary ask for an index that historically moves less than 1% per day in either direction. That’s why credit spreads are such a useful tool to give options traders an edge.
If Pete’s right, a drop in volatility means a trader could collect options premium on a decline of extrinsic value even if stocks stay relatively flat. Likewise, if a trader were to go long on an option during a decline in volatility, that trader could potentially lose money to a decline in extrinsic value. That’s why it’s so important to monitor volatility, and the VIX is the best tool to do it.