
Cryptocurrency
Trading Bitcoin: Price Cleared for $13.5k
Price Cleared for $13.5k Price is cleared for $13.5k now that Bitcoin experienced a parabolic rise by increasing over 18% over the course of Friday and Saturday. While Bitcoin has been overdue for a pullback since $6k, price continues to rise with no signs of slowing down. As of now, there are likely two possibilities […]
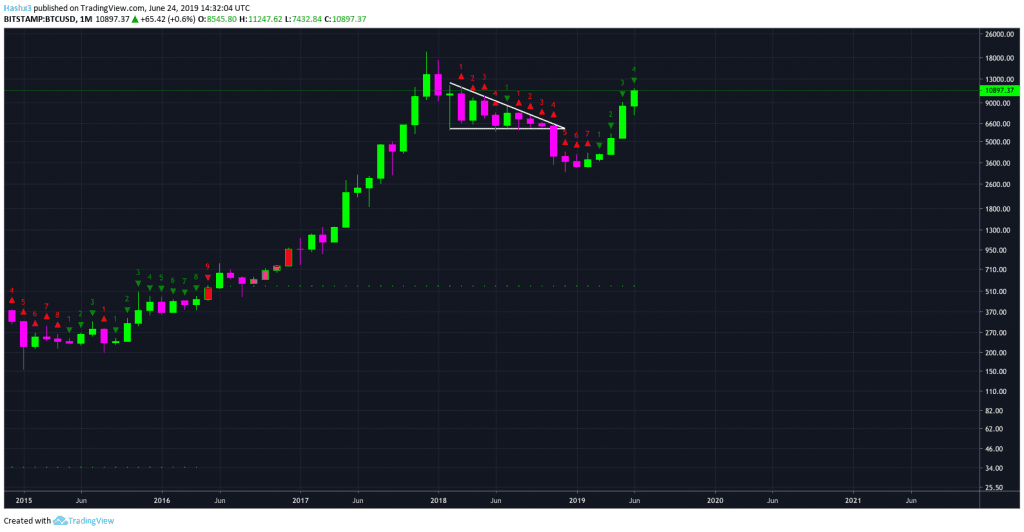
Price Cleared for $13.5k
Price is cleared for $13.5k now that Bitcoin experienced a parabolic rise by increasing over 18% over the course of Friday and Saturday. While Bitcoin has been overdue for a pullback since $6k, price continues to rise with no signs of slowing down. As of now, there are likely two possibilities left. First, Bitcoin pulls back 30-40% at a price target of roughly $7k-8k. Second, Bitcoin remains overbought and makes new all-time highs. Either way, we have seen an unprecedented run in the price of Bitcoin since May of 2019. Markets can bubble and make investors and traders feel elated. However, when price increases drastically within a short period of time, price then has the potential to fall harder and faster than it increased. Currently, Bitcoin is bullish according to the sequential indicator across multiple time frames.
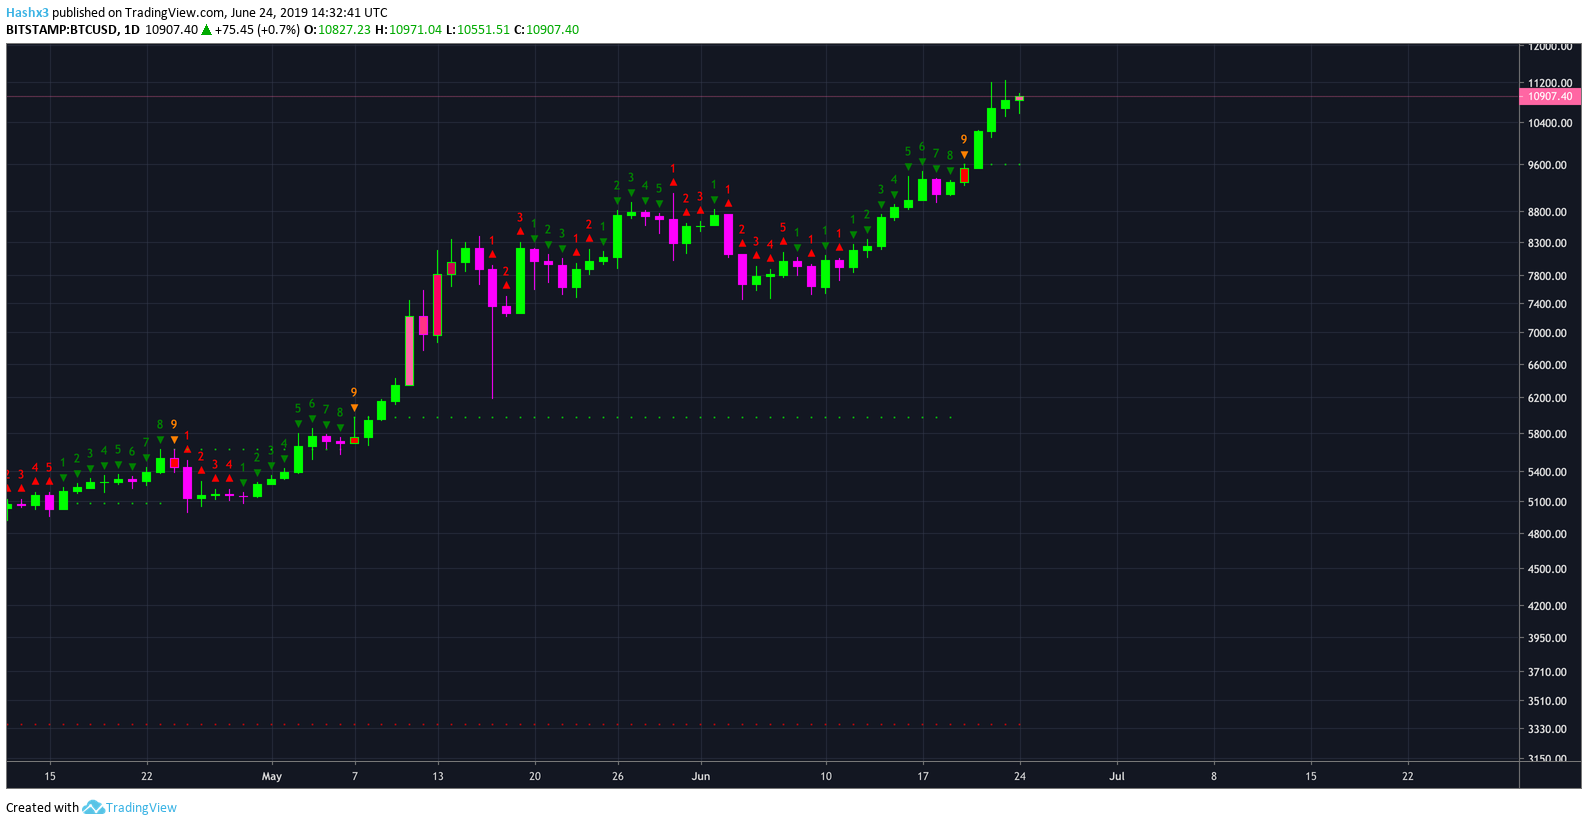
Daily
Last Friday, Bitcoin reached a sequential green 9 on the daily chart above. Reaching a green 9 in one sequence is a bullish indicator. The laws of sequential will tell you to take a break from trading when price gives you a green 1 following a green 9. Subsequently, a green 2 going above a green 1, following a green 9 is an indication to take a long trade. If you were to take this trade at roughly $9.8k, you’d be sitting in a decent profit with Bitcoin now trading at a price of $10.8k. Now Bitcoin has reached a green 4 candle following a green 9 sequence. Therefore, sequential is telling us that price is very bullish for the next three days. Within this time period, there is a high likelihood that price will test the 0.618 fibonacci resistance level at $13.5k.
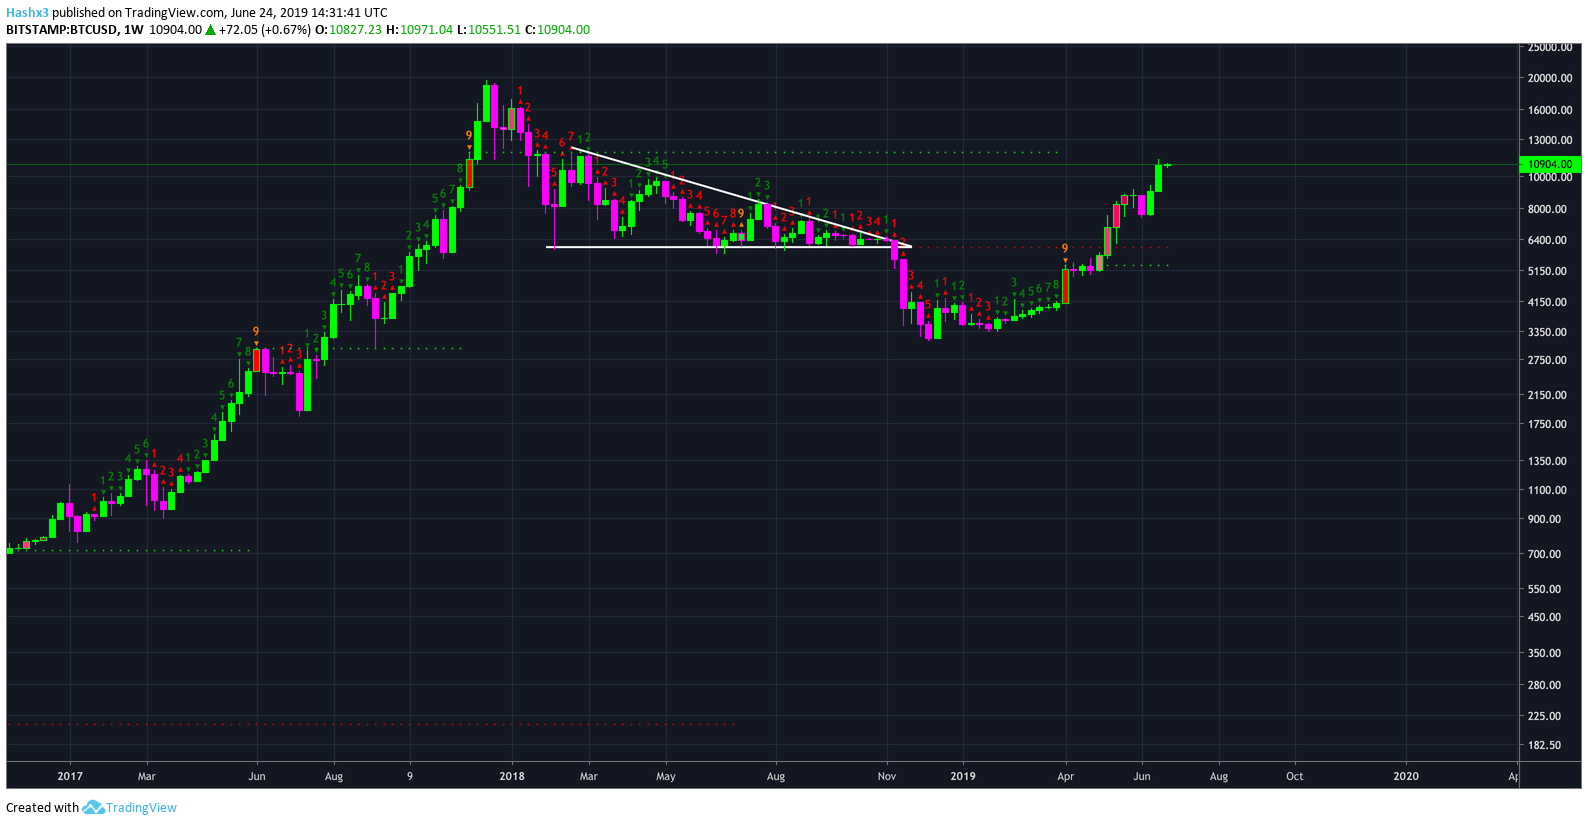
Weekly
Bitcoin is currently on a green 3 candle. Therefore, sequential is telling us that there will be 4 more weeks of upside before a potential trend reversal or pullback. While many of our other indicators and oscillators have been signaling overbought conditions for the past two months, these metrics can remain overbought for months at a time. Furthermore, a pullback of 30-40% is still likely, but a retest of $13.5k appears as if it will occur first, at least according to our current metrics and circumstances.
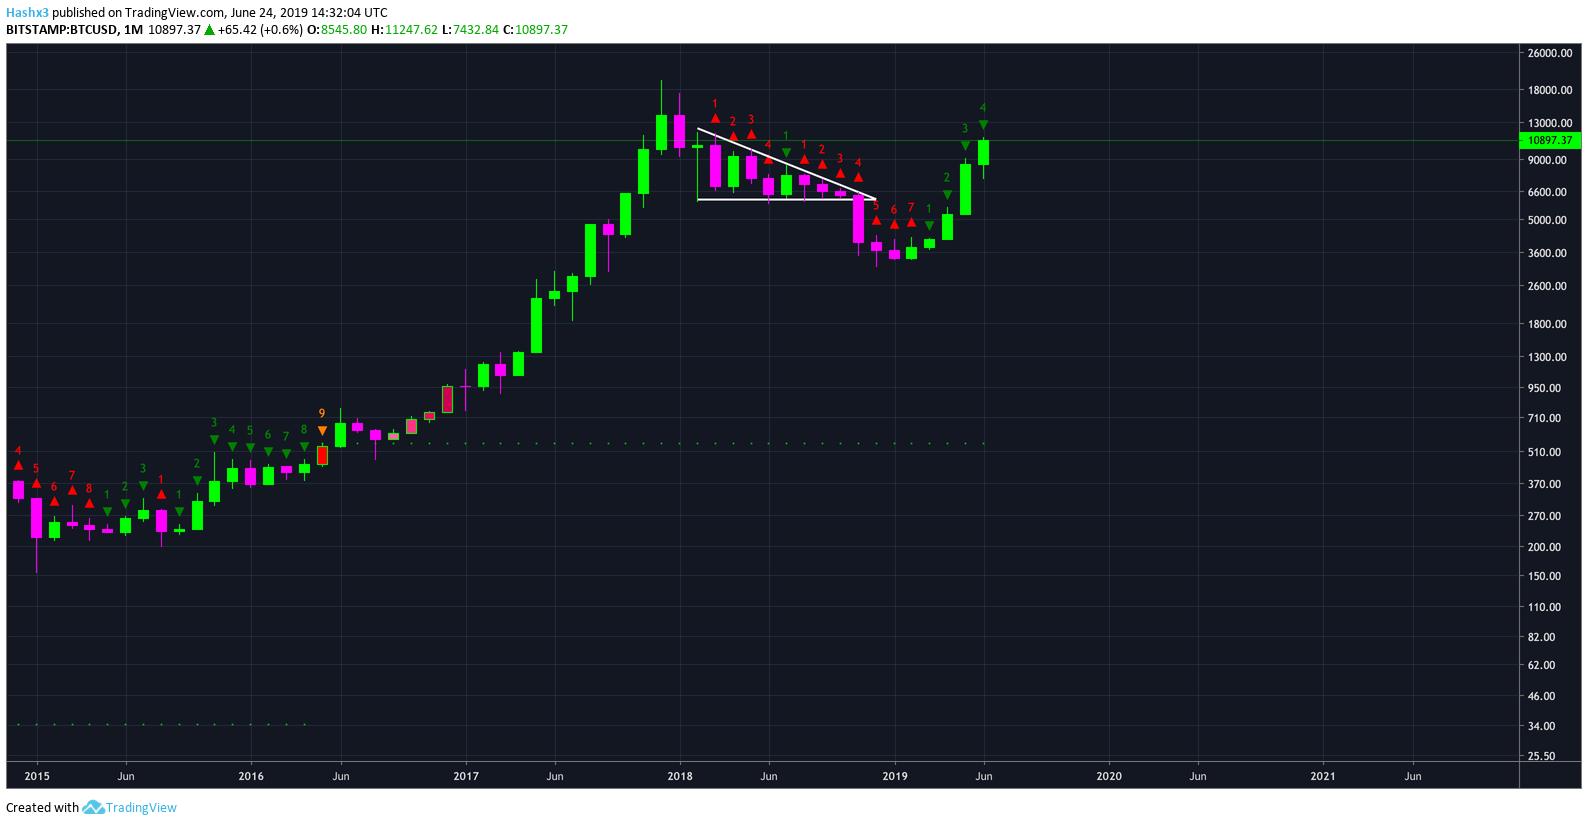
Monthly
It is incredibly frightening how bullish Bitcoin’s monthly chart (above) is. Currently, we are on a green 4 of 9 candle with no signs of slowing down in the near term. While many pullbacks of +30% occur over bull market cycles, our current macro trend is incredibly bullish for the next three to nine months. After a breach of the psychological barrier of $10k, it may be safe to assume Bitcoin has officially bottomed at $3.1k.
Cryptocurrency News
The recent parabolic move in Bitcoin may be attributed to Facebook’s popular cryptocurrency project Libra. The mainstream attention Libra received over the past week may have led retail investors to think more optimistically about the cryptocurrency industry collectively. However, Facebook’s Libra still faces many regulatory obstacles and the massive hype may die down within the next couple months. This scenario is conceivable, but it cannot be proven. In a previous article we explored this concept in-depth.
Conclusion
While Bitcoin has been due for a pullback since $6k, Bitcoin can only move in two directions. Our current momentum will likely take us higher with the closest resistance level being the 0.618 fibonacci level at $13.5k. Currently, $10k is serving as support. If $10k is purged, look for a correction of 30-40% into the $7k-$8k region. A hypothetical dip of 30-40% would present an excellent time to buy the dip. After all, a pullback of that nature may be the last time to buy a 4-digit Bitcoin.
Disclaimer: The author of the article owns Bitcoin.