
Cryptocurrency
Trading Bitcoin: Ascending Triangle on the 1 Hour
1 Hour Bitcoin is in a tentative ascending triangle on the 1 hour chart above. In classical technical analysis, an ascending triangle will break to the upside roughly 70% of the time. Based on our current momentum we are expecting a breakout. However, we must be cautious of a false breakout. Above all, a pattern […]

1 Hour
Bitcoin is in a tentative ascending triangle on the 1 hour chart above. In classical technical analysis, an ascending triangle will break to the upside roughly 70% of the time. Based on our current momentum we are expecting a breakout. However, we must be cautious of a false breakout. Above all, a pattern means nothing until confirmation.
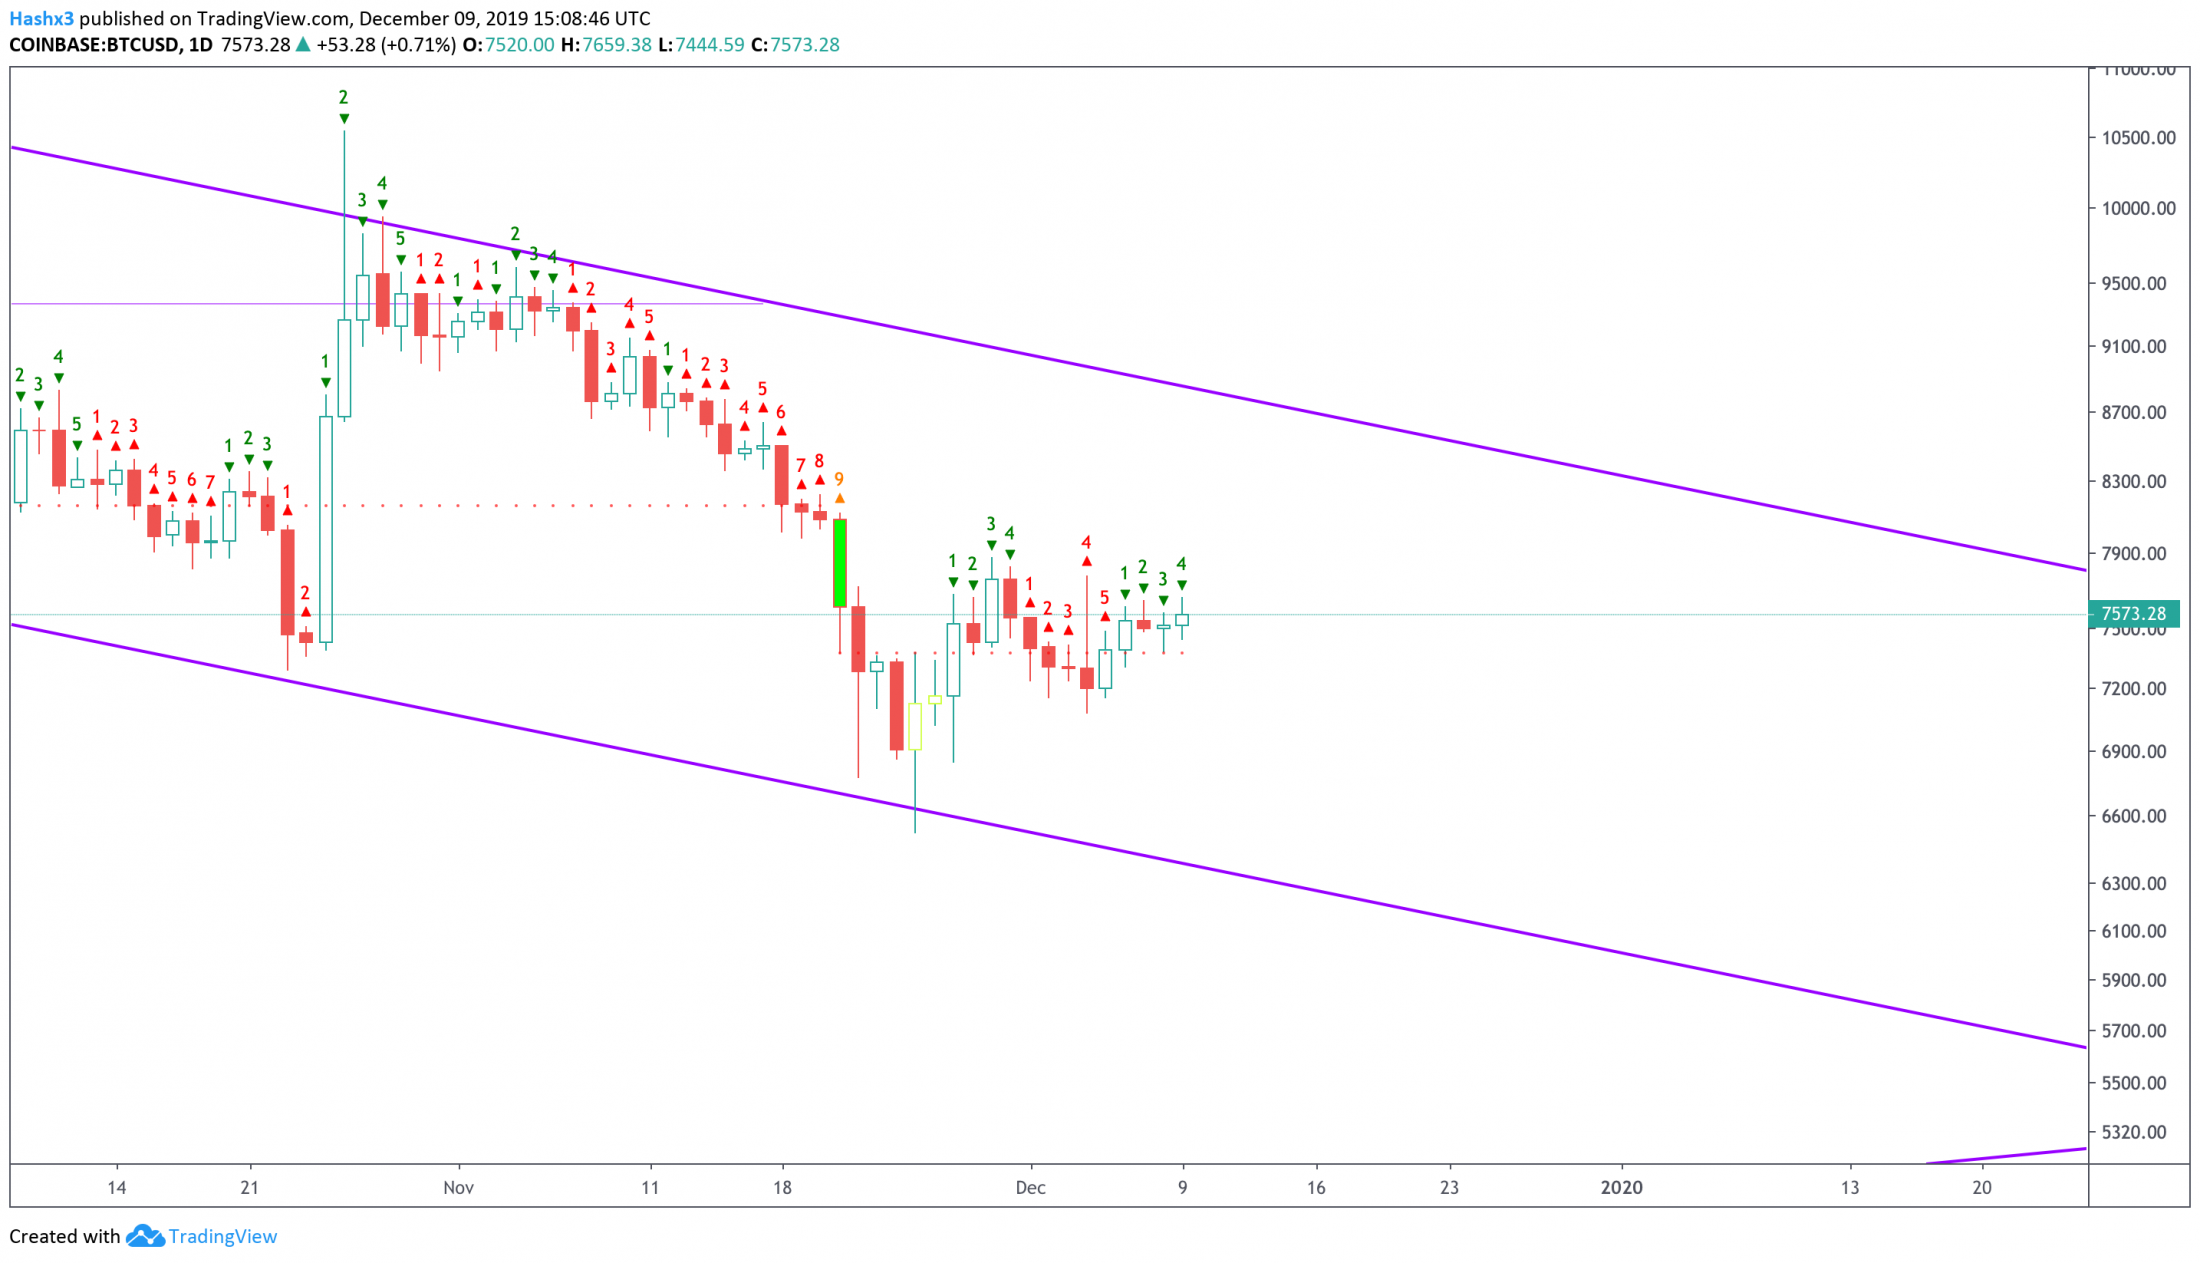
Daily
Bitcoin is on a sequential green 4 candle on the daily chart above. Overall, Bitcoin is seeing short-term bullish momentum which will likely continue up to $7.7k. However, Bitcoin has still been traveling in the downward parallel channel.
Conclusion
Disclaimer: The author of the article hodls Bitcoin.