
Cryptocurrency
Trading Bitcoin: Back Above $11k, Now What?
Back above $11k Bitcoin is back above $11k and many traders are puzzled by the volatility in the market. While Bitcoin has increased 20% over the last 32 hours, that doesn’t mean the overall trend will continue to be bullish. In fact, Bitcoin is continuing to make lower highs and lower lows since peaking at […]

Back above $11k
Bitcoin is back above $11k and many traders are puzzled by the volatility in the market. While Bitcoin has increased 20% over the last 32 hours, that doesn’t mean the overall trend will continue to be bullish. In fact, Bitcoin is continuing to make lower highs and lower lows since peaking at roughly $14k. On the 4 hour chart above, the TD sequential indicator is on a green 7 of 9 candle. Therefore, price will be neutral for the remaining 8 hours of the count before a possible reversal.
Weekly
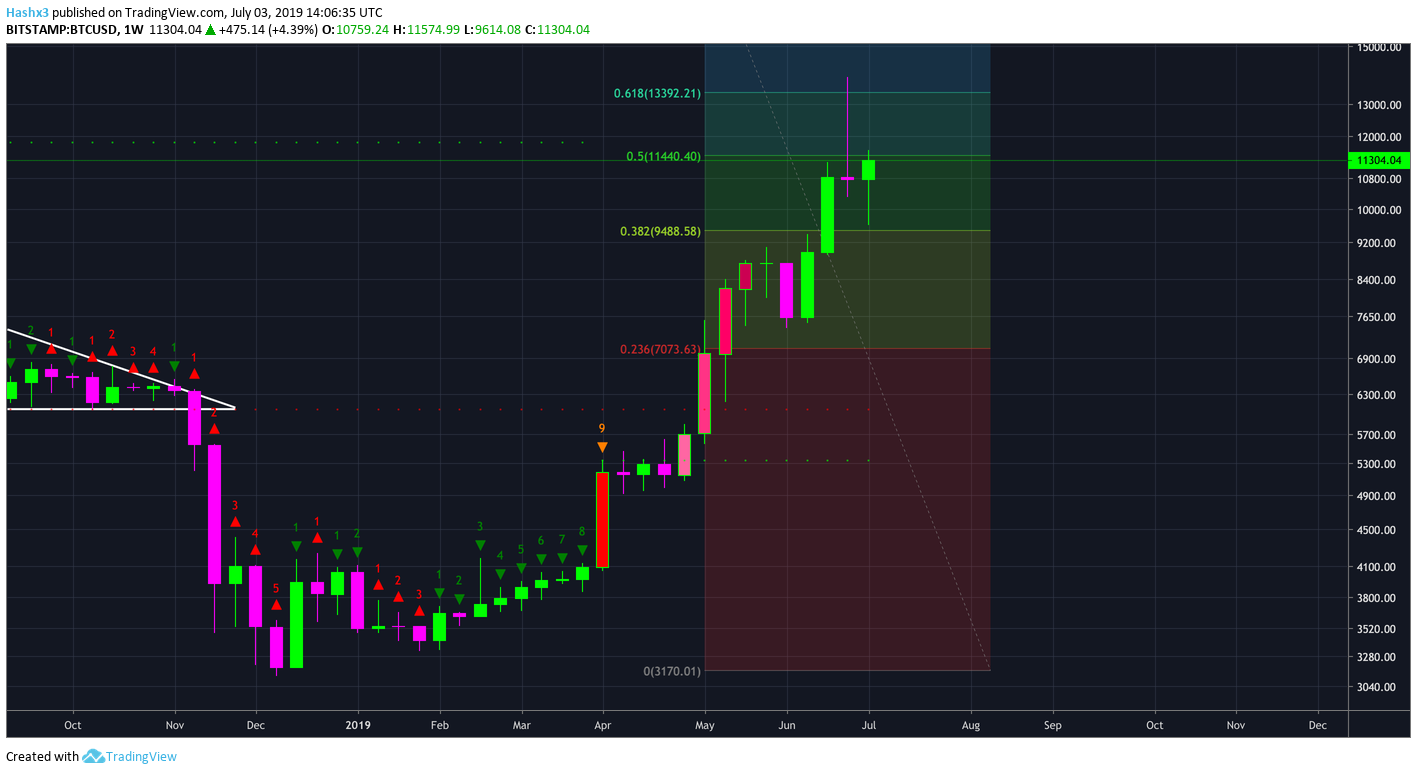
From a weekly perspective, Bitcoin gave us an ugly reversal candle last week. While our current weekly candle has yet to close, last week’s close was one of the most bearish doji candles we’ve experienced throughout the entire May-June uptrend. A doji candle of this sort typically leads to a trend reversal. Additionally, Bitcoin’s parabolic run was rejected by the 0.618 fibonacci level. We have now found support at the 0.382 fibonacci level at roughly $9.5k, but if this support level cannot hold, Bitcoin may be due for a larger pullback.
NVT Indicator
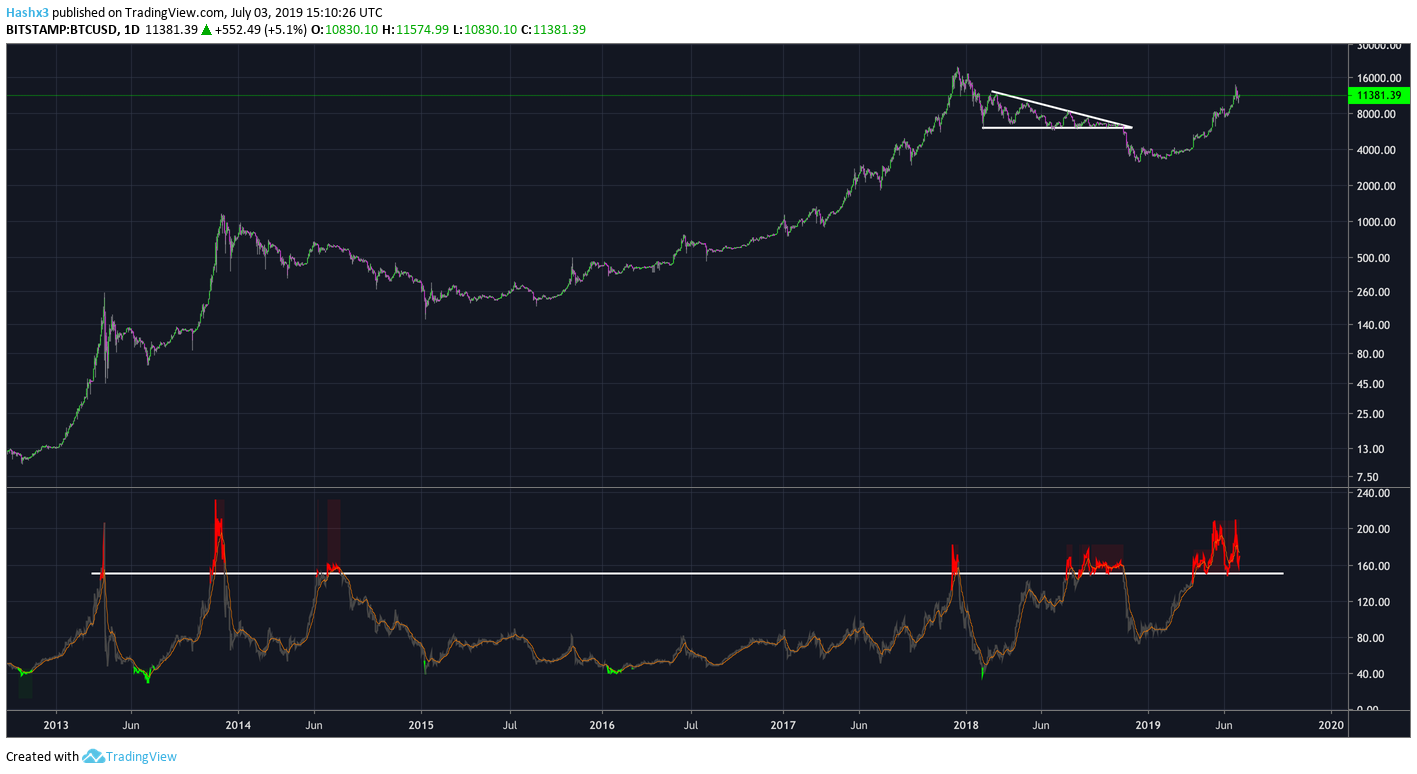
In yesterday’s article we highlighted the NVT indicator. Bitcoin’s NVT indicator came extremely close to dangerous territory yesterday as the support level at 150 was almost broken. Bitcoin has been in overbought territory on the NVT indicator since April. The NVT indicator has had incredible accuracy when calling overbought and oversold conditions throughout Bitcoin’s lifetime. If the NVT falls below support at 150, Bitcoin will likely experience a large sell off. For more information about the NVT indicator, visit Willy Woo’s site.
Conclusion
Bitcoin’s back above $11k and for now, $9.5k is the strongest support level for Bitcoin. $9.5k also aligns with the sequential setup trend line and the 0.382 fibonacci level. If Bitcoin falls below this level in the coming weeks, look for an optimal buying opportunity. Until we break above $12.3k, the recent price increase is nothing more than a reaction rally coming after a large sell off. In order for the trend to remain bullish, Bitcoin must surge above our previous high at $12.3k.