
Cryptocurrency
Trading Bitcoin: Back Above $6K, What Now?
Daily On the daily chart above, Bitcoin is on a red 4 on the sequential indicator. In sequential theory, when price reaches a 9, it will sometimes go into what is called ‘a 1-4 candle correction’. For example, if Bitcoin reached a red 9 and price responds with 4 candles of the opposite color, this […]

Daily
On the daily chart above, Bitcoin is on a red 4 on the sequential indicator. In sequential theory, when price reaches a 9, it will sometimes go into what is called ‘a 1-4 candle correction’. For example, if Bitcoin reached a red 9 and price responds with 4 candles of the opposite color, this is a textbook example of a 1-4 candle correction. Once the trend reaches a 4 of the opposite color, it will typically experience a price flip and continue the initial trend it was on before the correction. Therefore, Bitcoin may now resume the bullish trend it was on prior to the 1-4 candle correction.
4 Hour
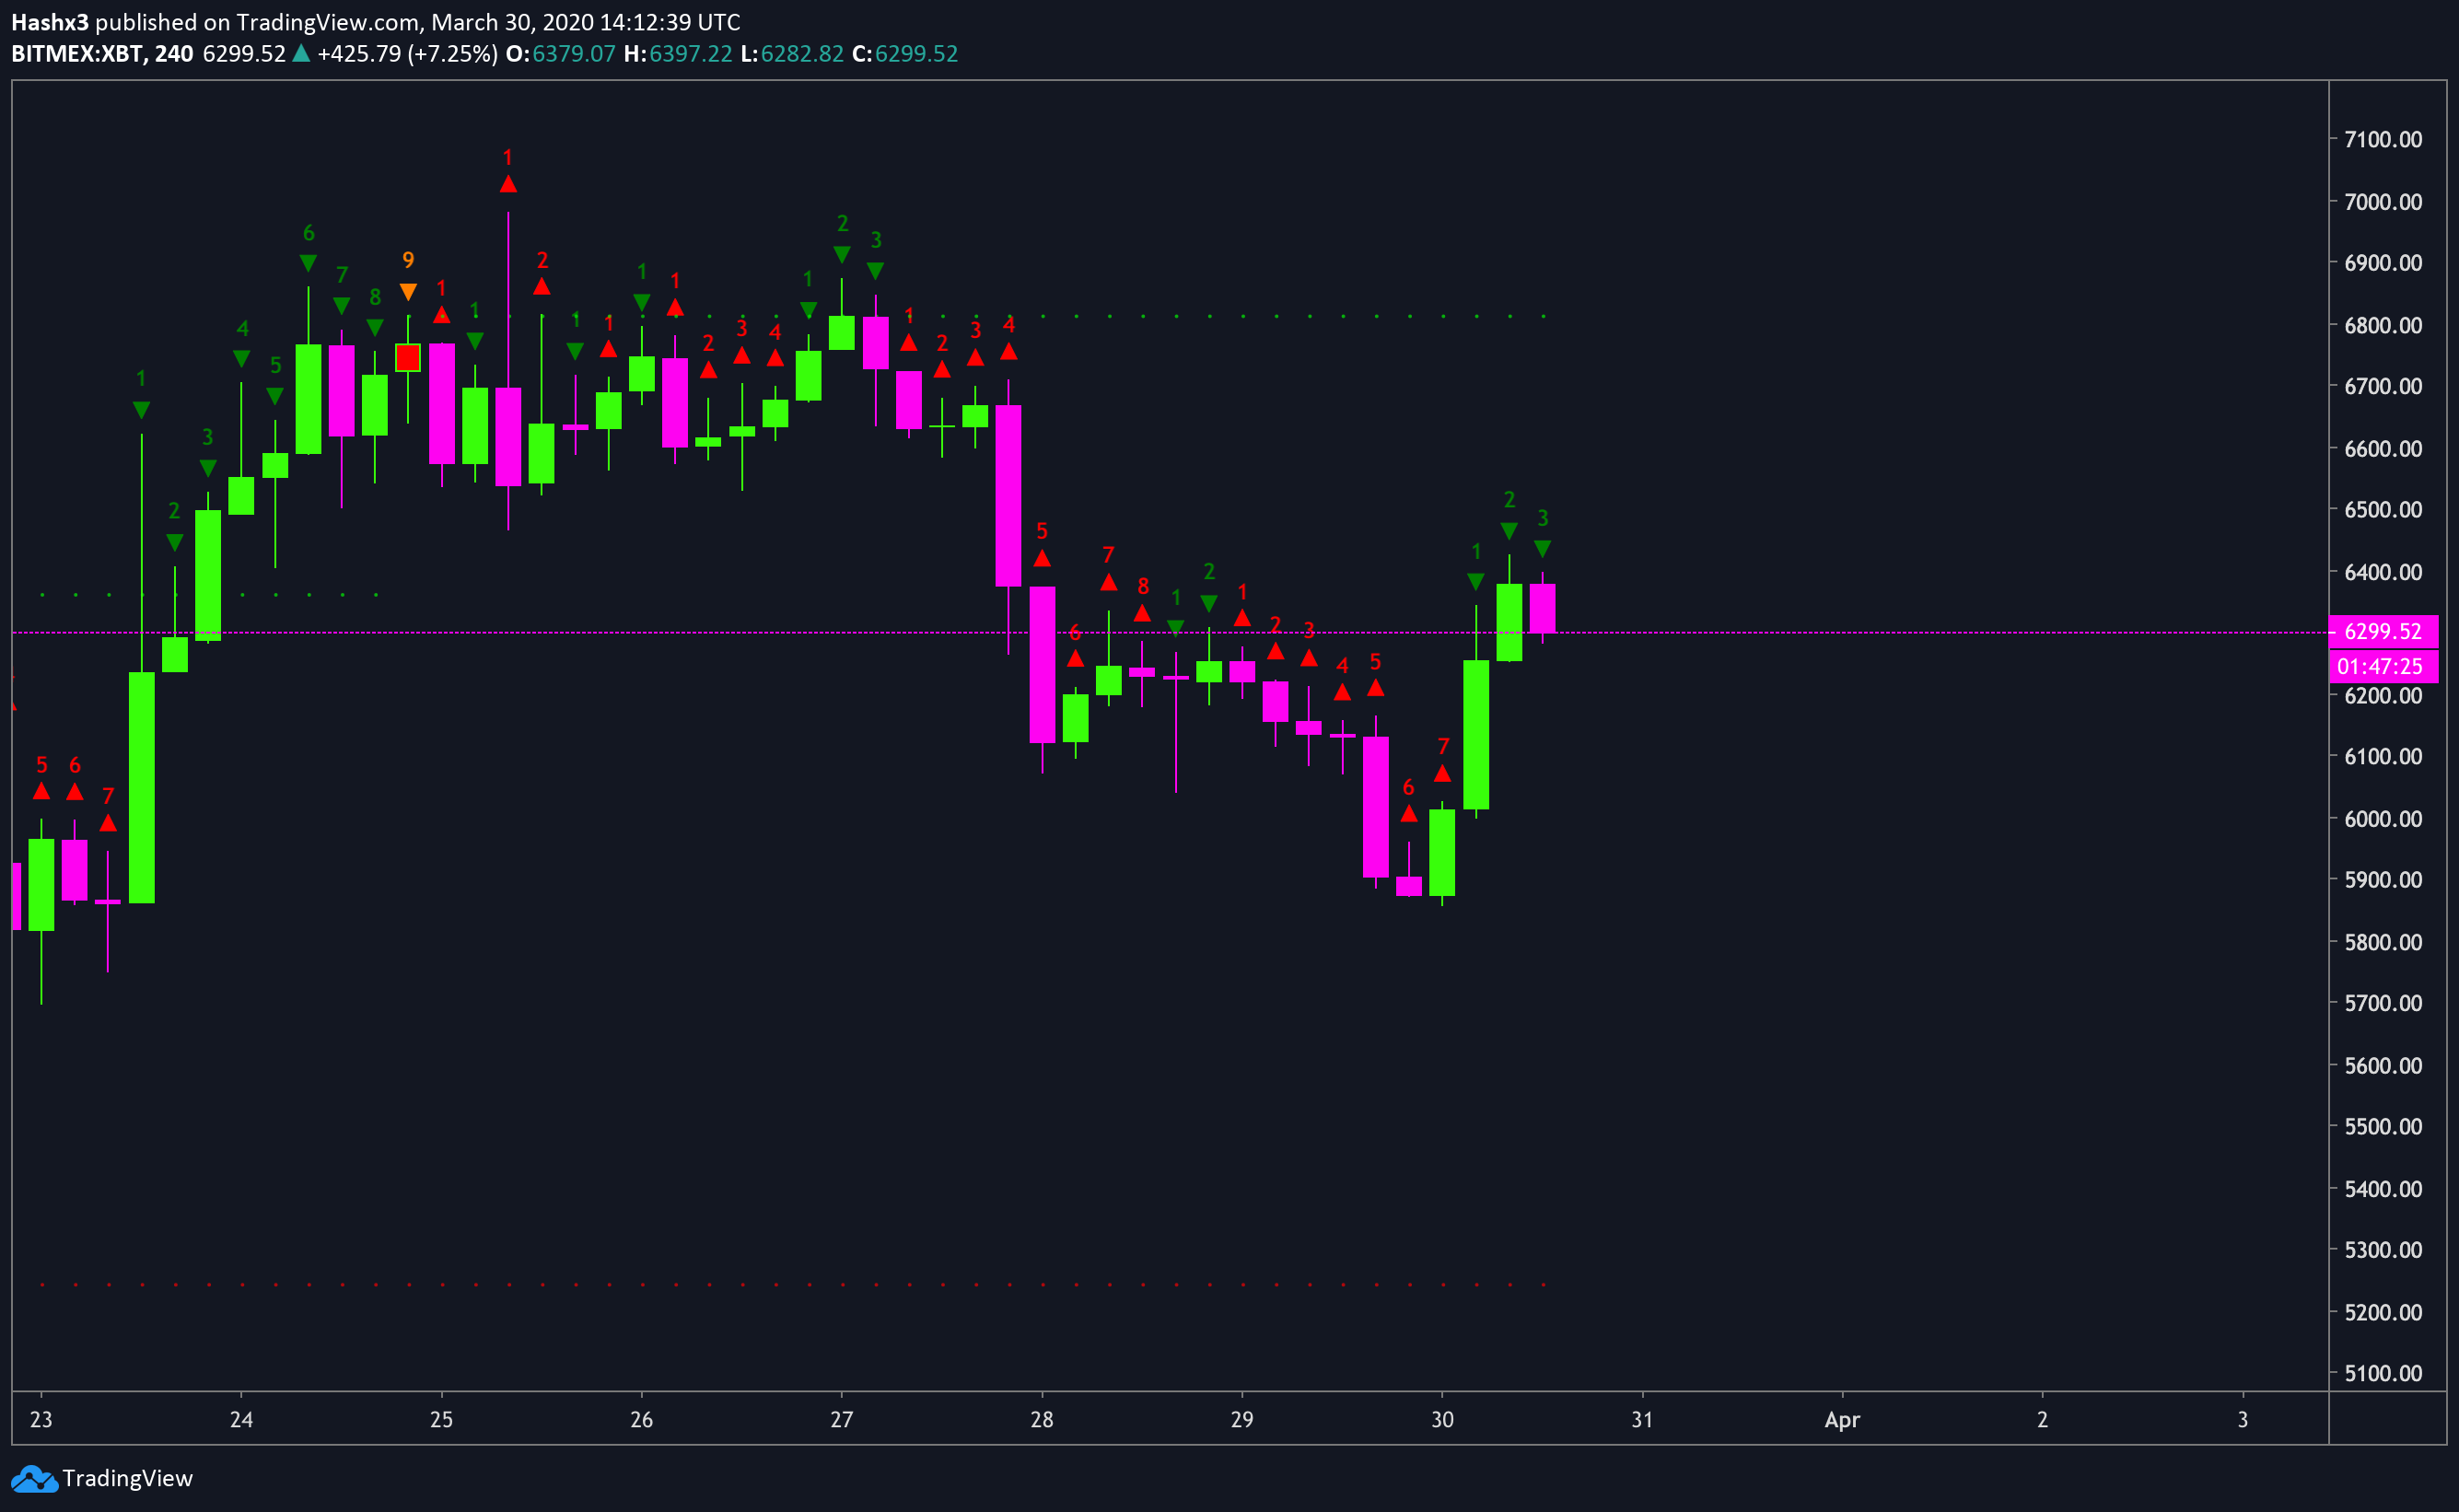
On the 4 hour chart, Bitcoin is now on a green 3 on the sequential indicator. A buy signal is triggered when a green 2 closes above the previous green 1 candle. Therefore, the sequential indicator has triggered a long trade on the 4 hour timeframe.
1 Hour
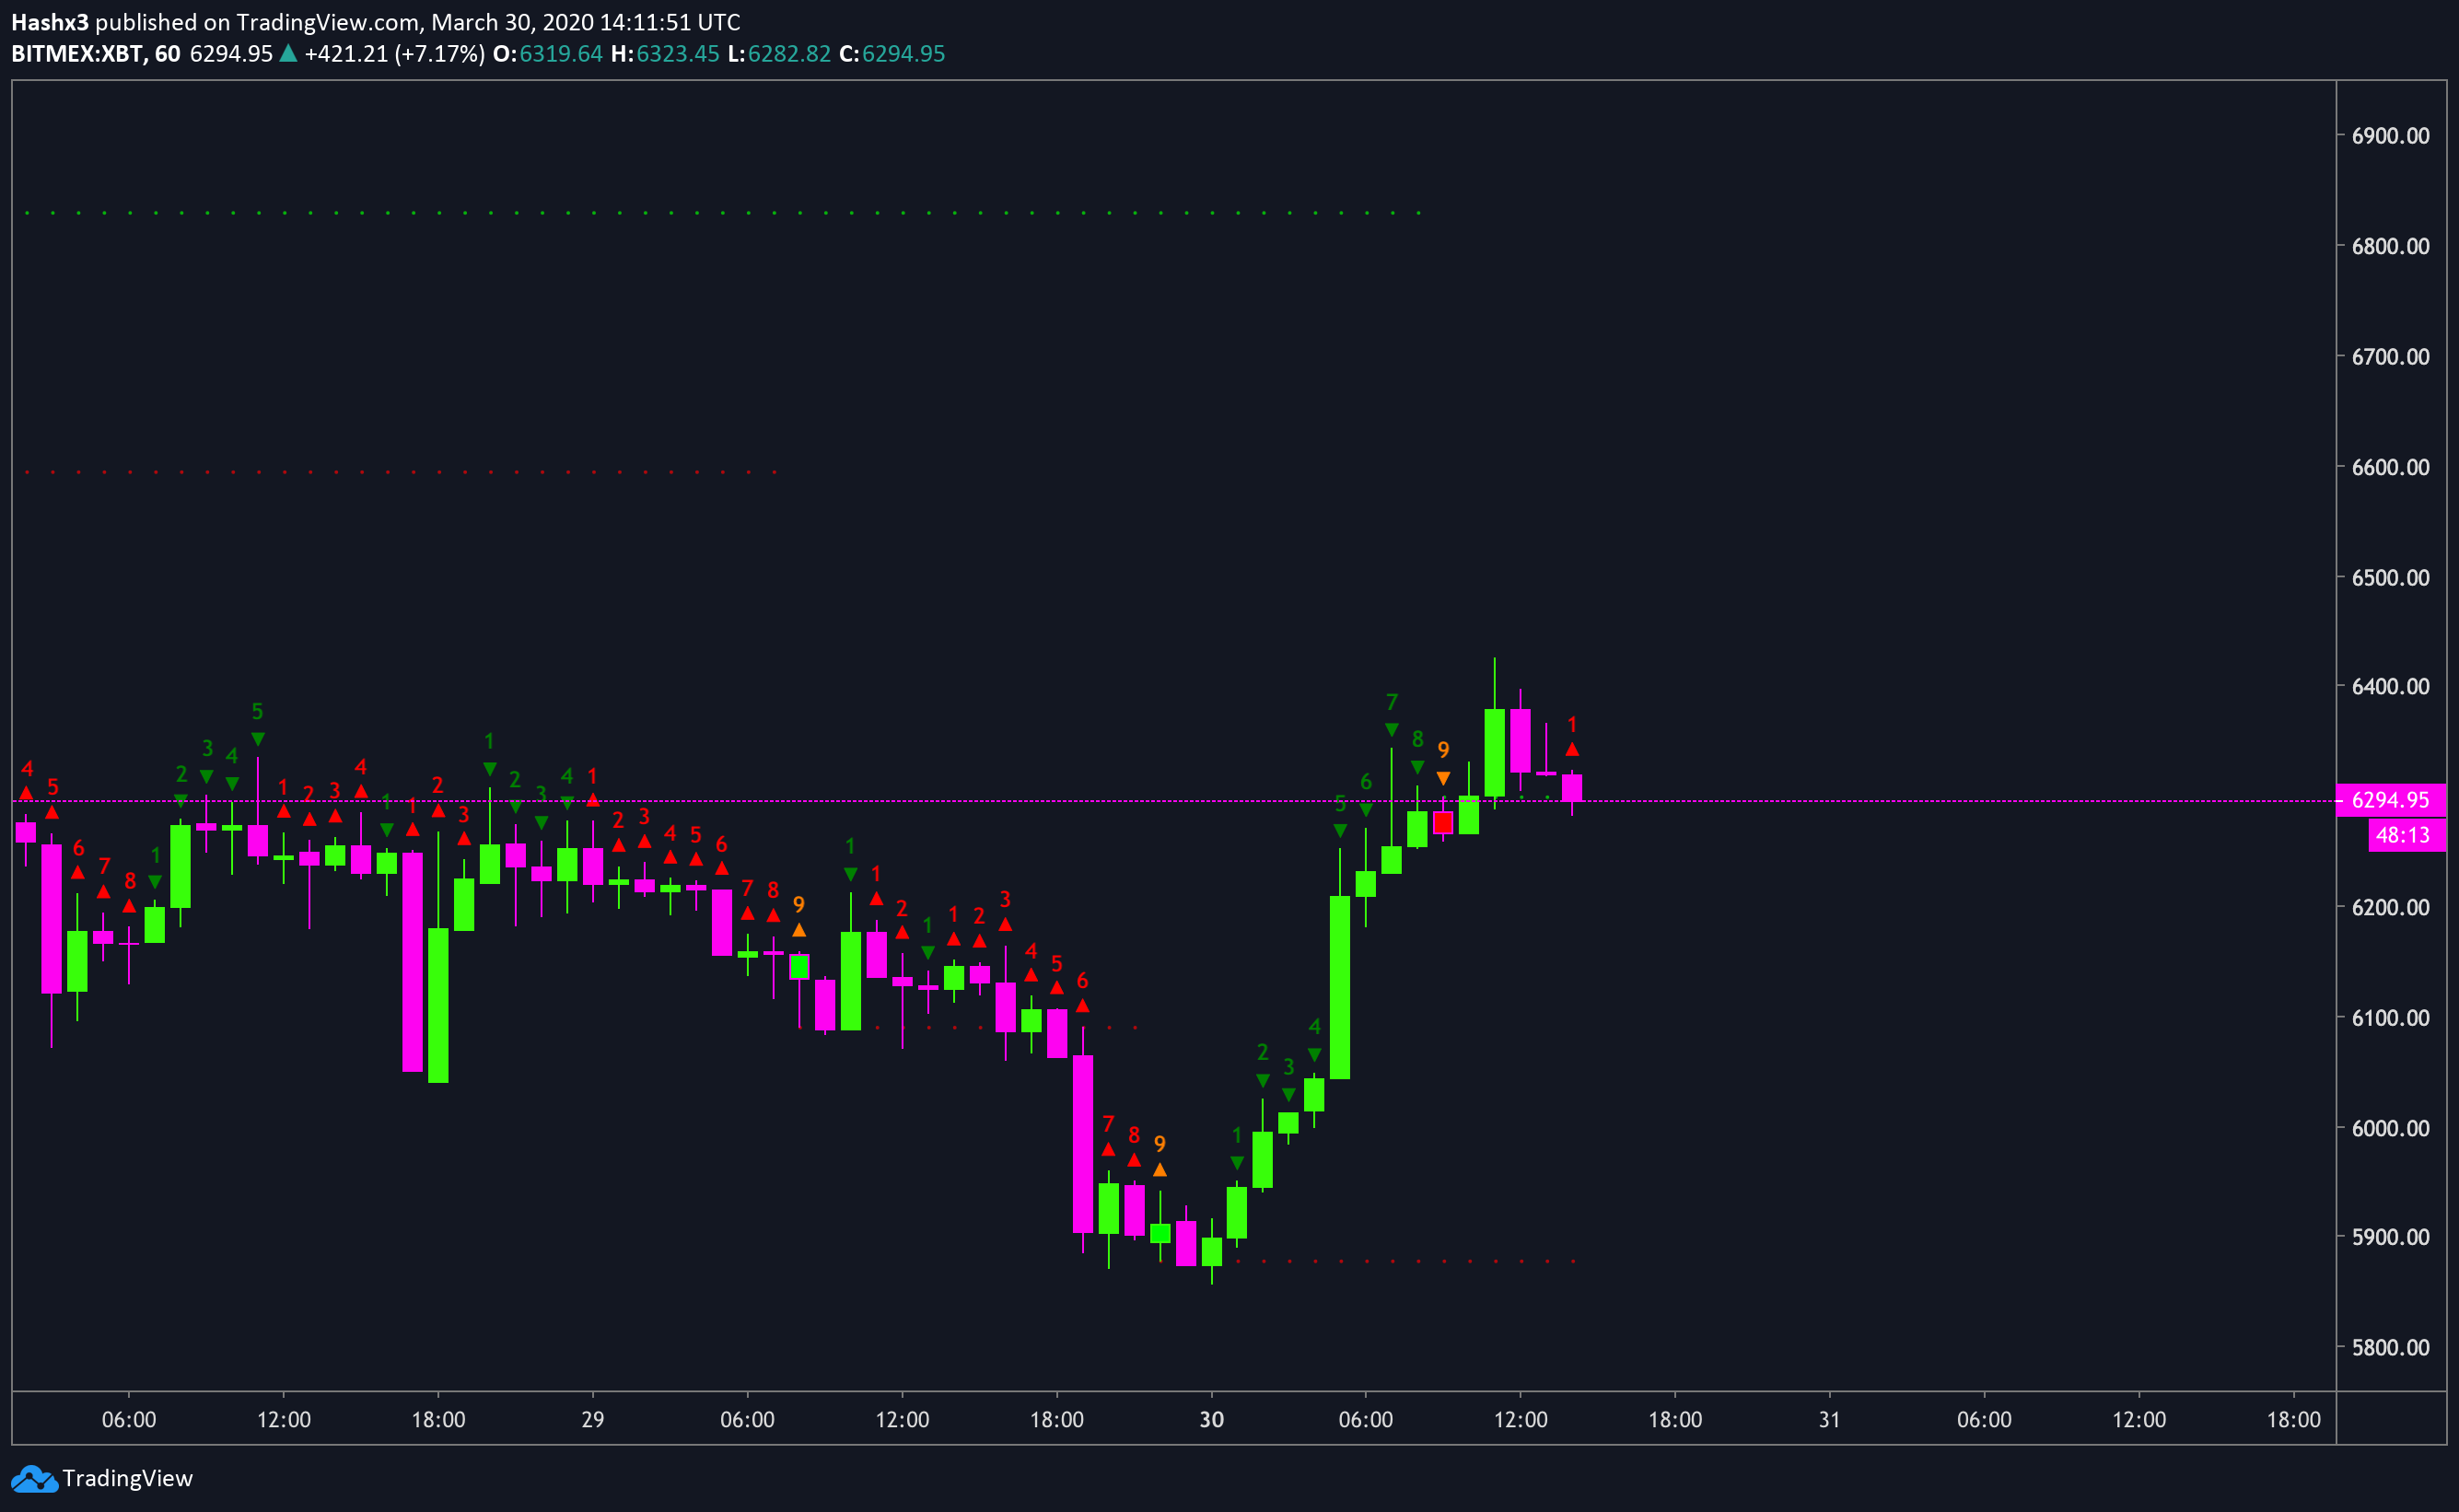
The sequential indicator has been nearly perfect on the 1 hour chart over the past two days. Currently, the sequential indicator is in a take-profit zone after topping on the green 9. While this interim correction is playing out, the 4 hour chart remains bullish.