
Cryptocurrency
Trading Bitcoin: Back at $7.3k
Weekly On the weekly chart above, we have just received our new weekly candle. Currently, the sequential indicator is on a red 3 candle. Furthermore, price is in a bearish – neutral posture on the weekly chart. The longer it takes Bitcoin to breakout of the purple downward price channel, the more potential we have […]

Weekly
On the weekly chart above, we have just received our new weekly candle. Currently, the sequential indicator is on a red 3 candle. Furthermore, price is in a bearish – neutral posture on the weekly chart. The longer it takes Bitcoin to breakout of the purple downward price channel, the more potential we have for lower prices leading up to the halving.
 Daily
Daily
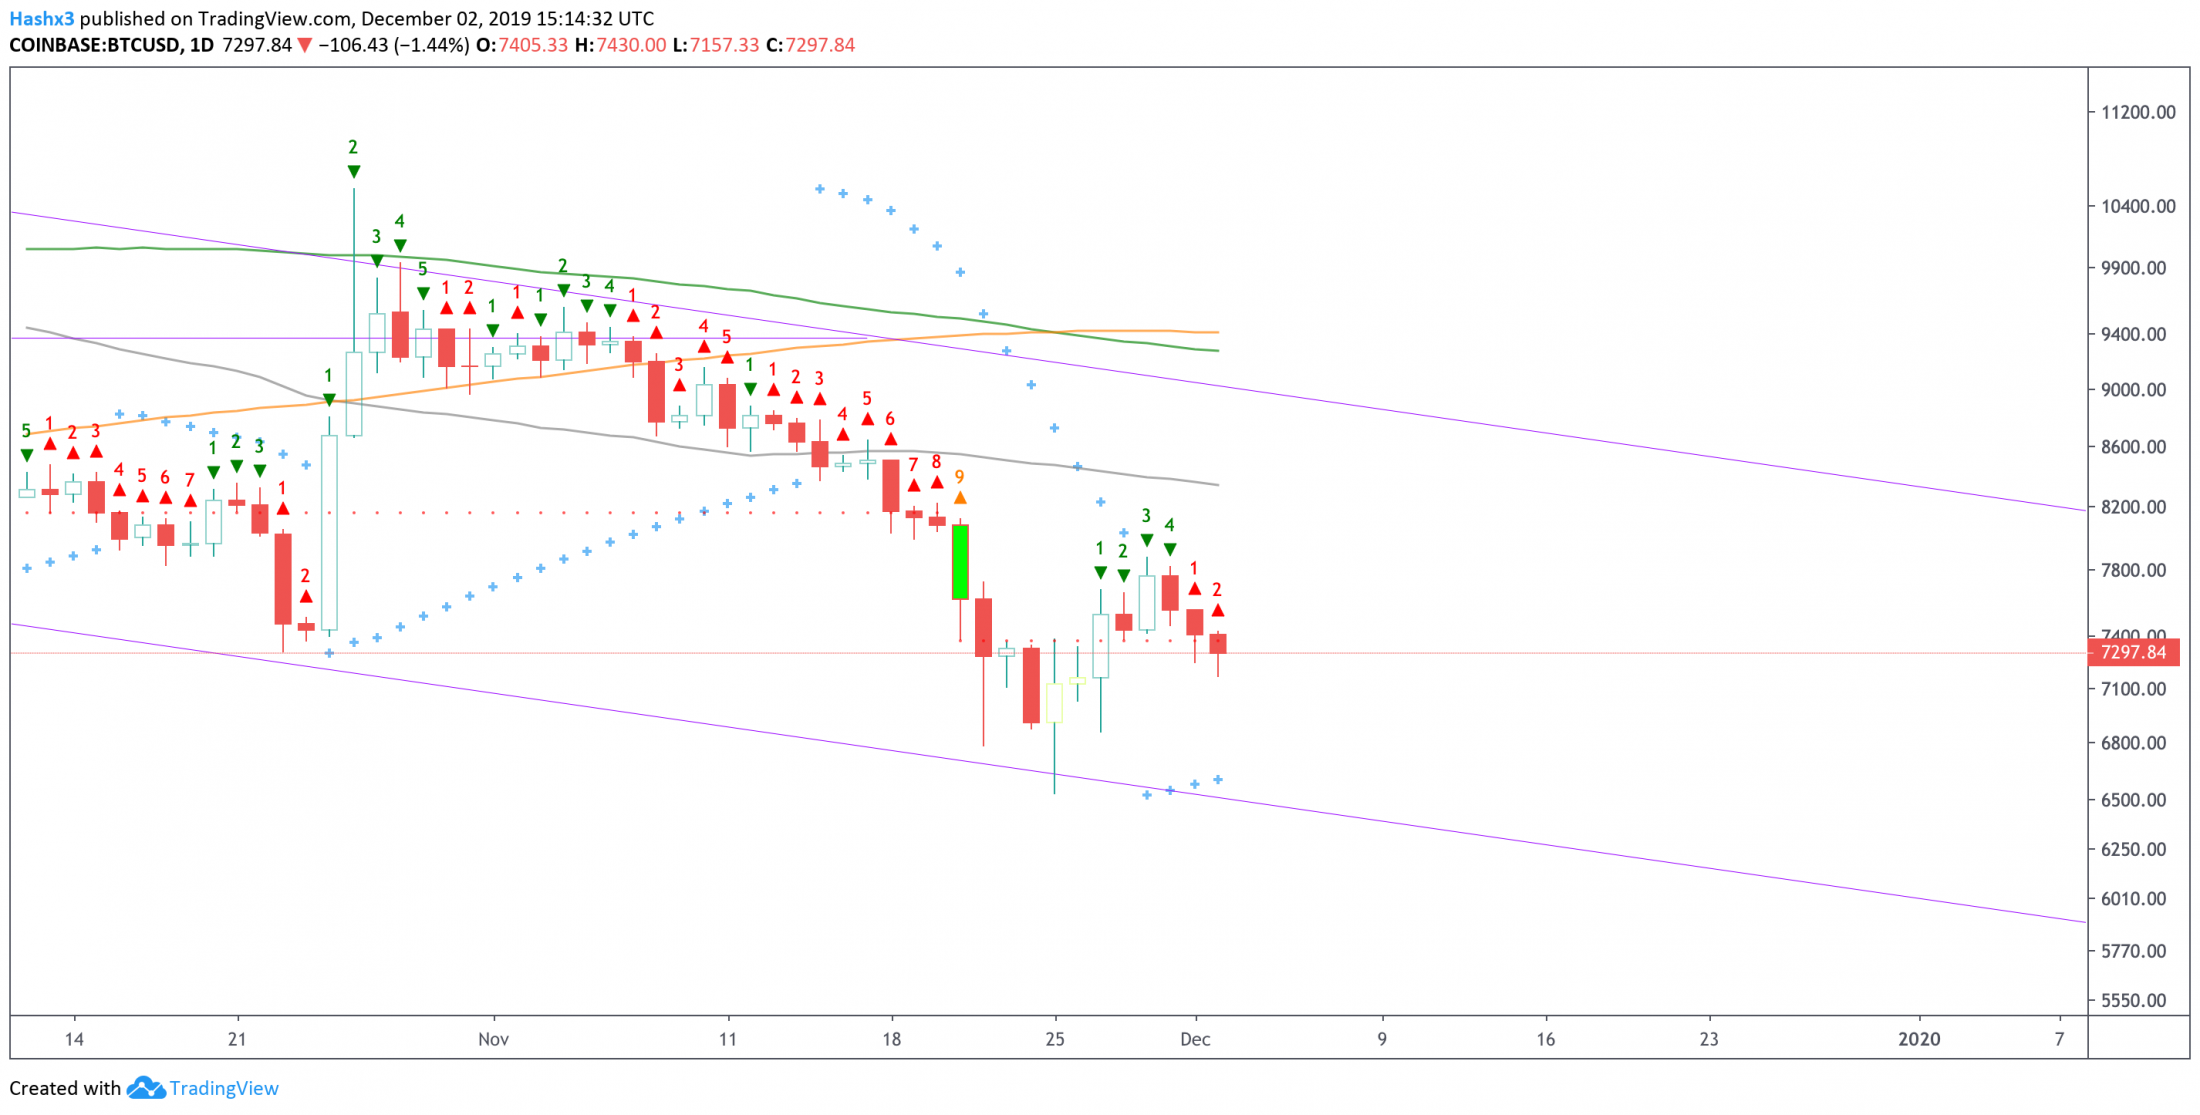
Bitcoin is on a red 2 of 9 candle on the daily chart above. A red 2 which closes below the previous red 1 is an indication to place a short trade based on sequential theory. However, the Lucid SAR (blue x’s) is in a bullish position and is acting as support below price. Being said, the trend is bearish and a retest of the bottom of the channel is a likely possibility.
4 Hour
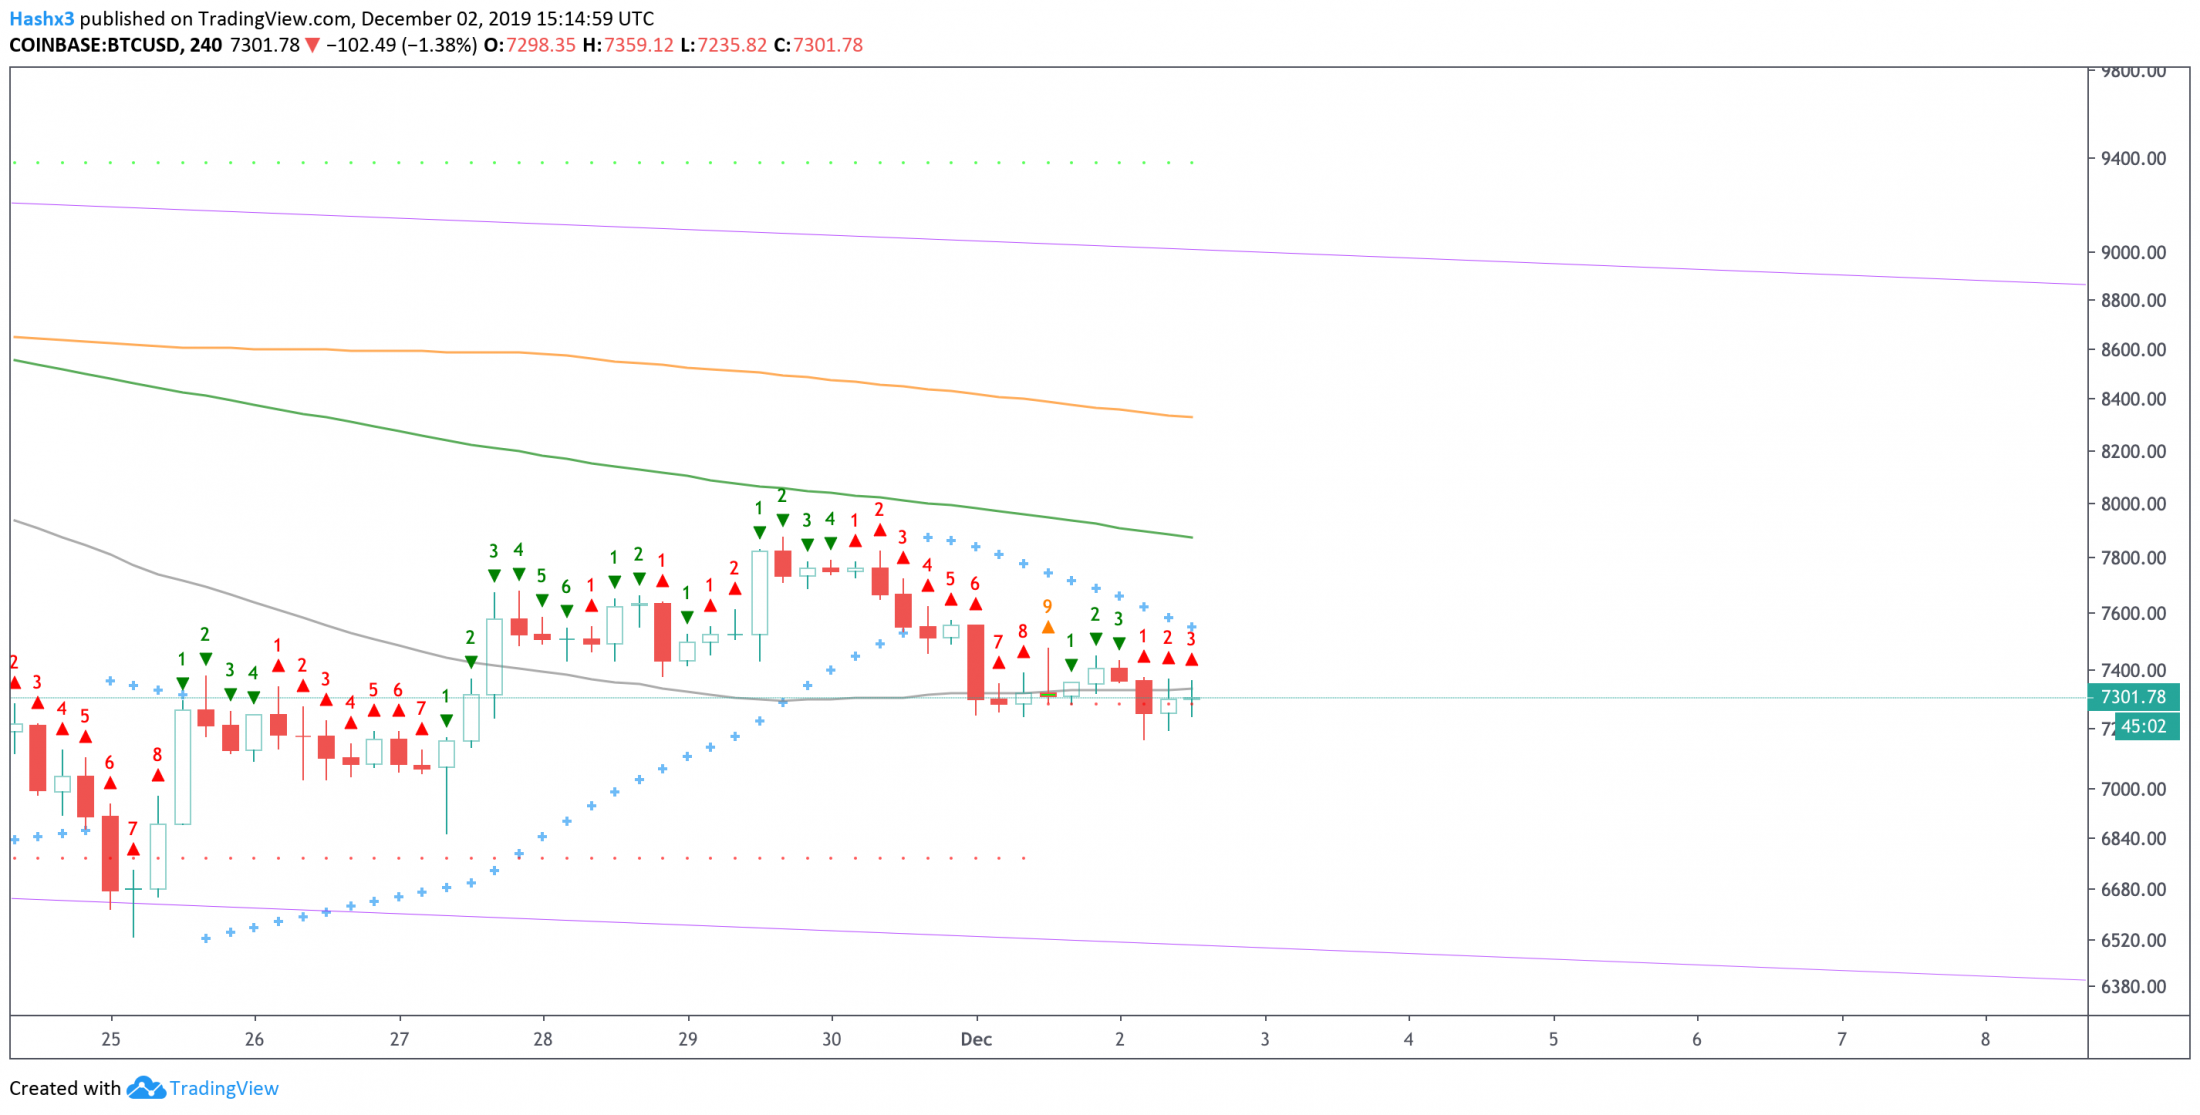
Bitcoin is on a red 3 of 9 candle on the 4 hour chart above. It is significant that price has closed below the 50MA (grey) which is considered a key metric for the overall momentum of the trend.
Conclusion
According to current indicators, price looks to be heading into a neutral-bearish territory.