
Cryptocurrency
Trading Bitcoin: Boom or Bust Coming For BTC?
Boom or Bust For the past week and a half, price has barely moved. The lack of volatility in the market means a large move will inevitably come in one direction or another. With the current indicators, price and time continue to provide us with bearish signals. On the daily chart above, Bitcoin is still […]

Boom or Bust
For the past week and a half, price has barely moved. The lack of volatility in the market means a large move will inevitably come in one direction or another. With the current indicators, price and time continue to provide us with bearish signals. On the daily chart above, Bitcoin is still trading below the 200MA (orange) which has been a strong resistance level for the past two weeks. If the bulls want to regain momentum, they must first break above this critical resistance level. Additionally, Bitcoin is on a red 2 of 9 candle. In sequential theory, a red 2 which closes below the previous red 1 is a signal to place a short trade. However, trading based on sequential is just one way to gage the market. At Market Rebellion, we prefer to look for confluence between indicators before placing a trade. For example, the Lucid SAR (blue x) is still in a bullish position below the target at a price of $7.8k. If the Lucid SAR shifted into a bearish position above price, then we would have enough confluence between indicators to place a short trade. For now, we remain on the sidelines until price breaks out of the no trade zone from $8k-$8.5k. Until then, Bitcoin remains neutral-bearish.
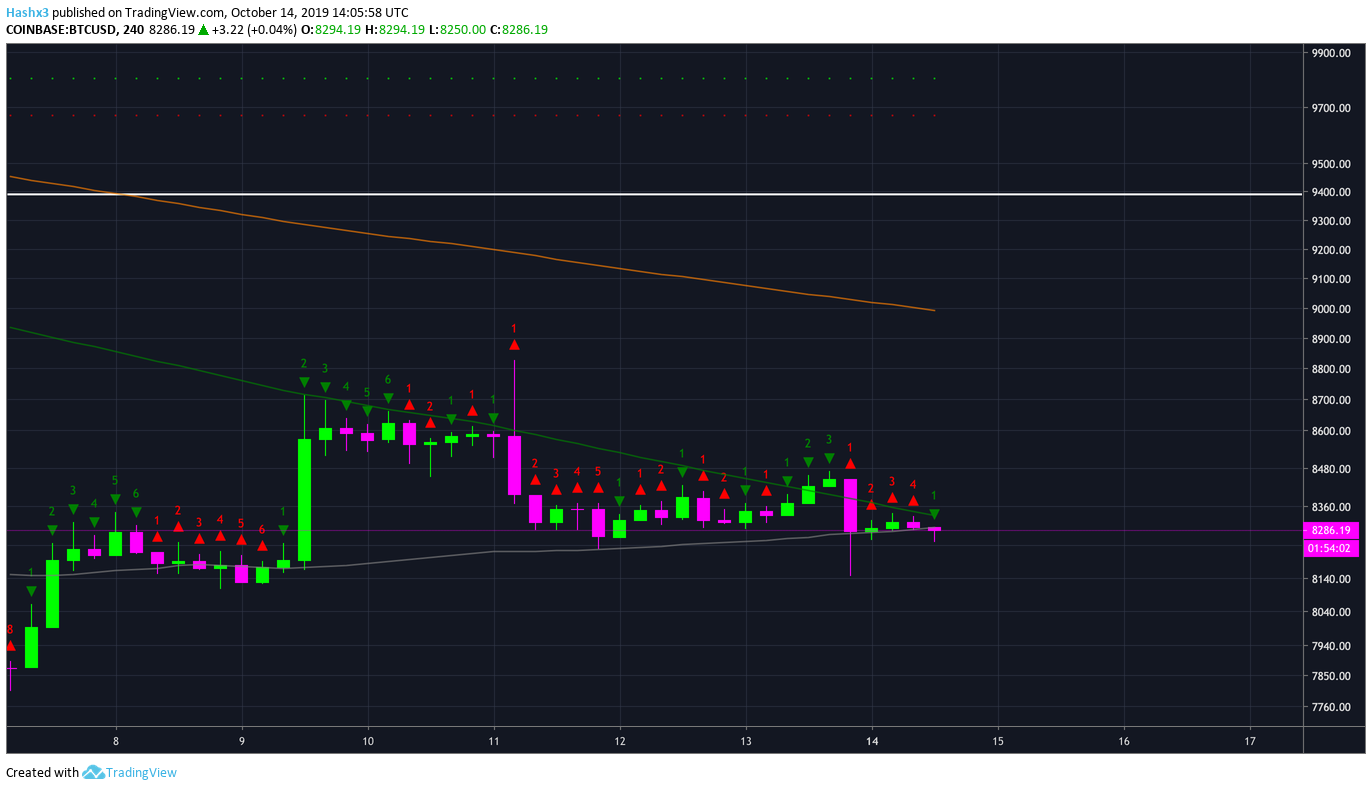
4 Hour
On the 4 hour chart above, price is being squeezed by the 128MA (green) and the 50MA (grey). When support and resistance levels begin to intersect like this, price can breakout in either direction. Due to the numerous bearish indicators seen on the daily chart, momentum is leaning toward the bears.
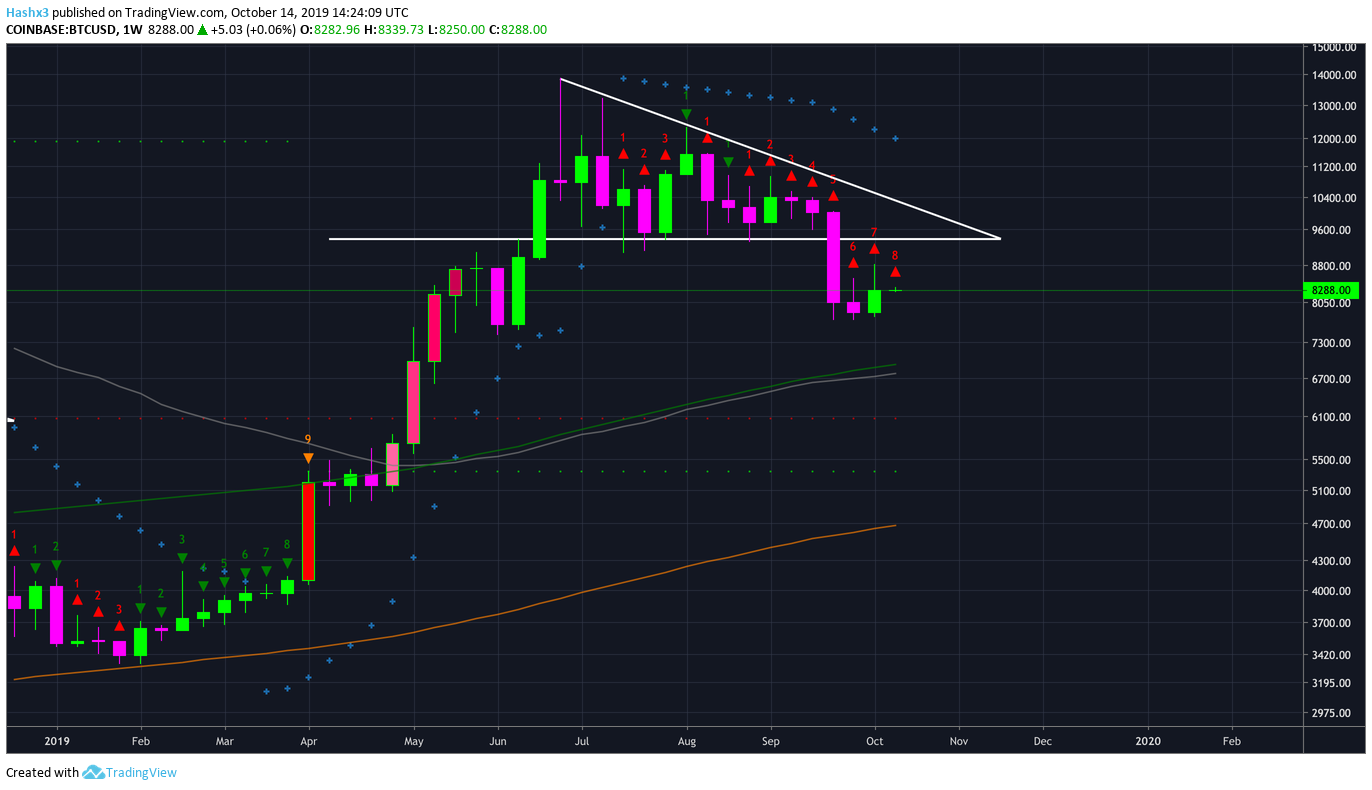
Weekly
As of today, price has given us a red 8 on the weekly chart above. The most prominent weekly support is the confluence between the 128MA (green) and the 50MA (grey) at $6.7k. If Bitcoin drops to these levels within the next week, the sequential indicator on the weekly chart will reach a red 9. If price gives us a red 9 next week, then we will have to re-evaluate the trend to determine the likelihood of a potential bottom.
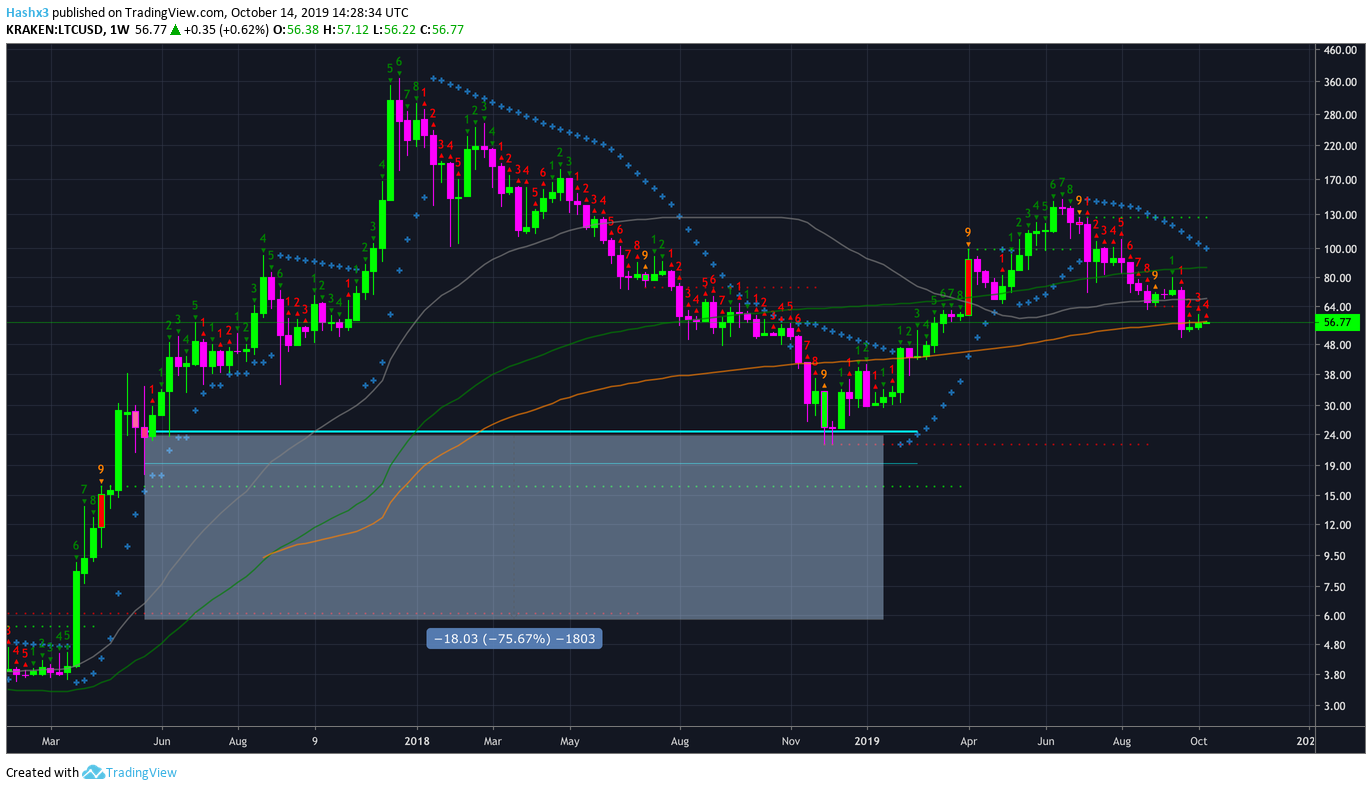
Litecoin Weekly
Litecoin is now trading below the 200MA (orange) on the daily. Litecoin also faces resistance from all three moving averages and is in a very bearish posture. Typically this kind of price action is not concerning for a large cap coin such as Bitcoin. However, Litecoin just went through a block halving in which the mining reward has been cut in half. As a result, a large portion of Litecoin’s hashrate has left the network.
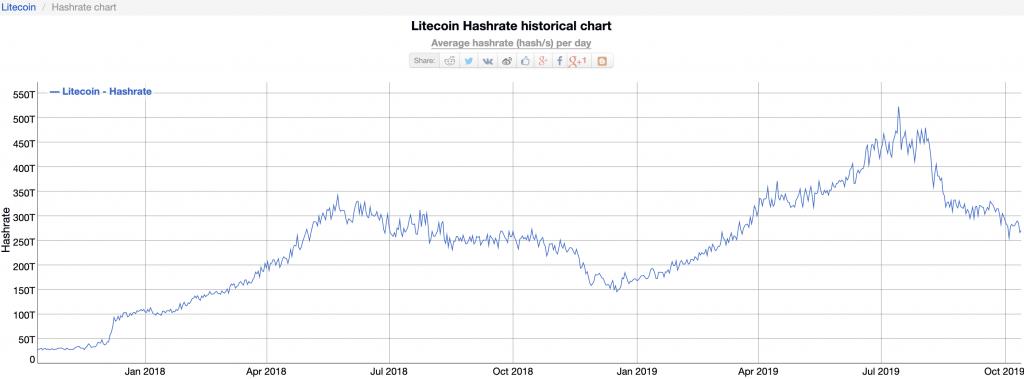
Litecoin Historic Hashrate
Hashrate ultimately determines how secure a network is. If a network’s hashrate is increasing, that means the overall security of the network is increasing, while a decreasing hashrate means the exact opposite. As you can see from the chart above, Litecoin has lost a significant portion of hashrate after their block halving occurred. Now miners are asking themselves the question, “why not mine Bitcoin if Litecoin is no longer increasing in price relative to Bitcoin, and providing a smaller block reward?” Litecoin’s loss of hashrate isn’t a critical vulnerability yet, but at Market Rebellion, we’ll continue to watch Litecoin’s hashrate as an indicator of overall network security.
Conclusion
Bitcoin remains in a no trade zone from $8k-$8.5k. The majority of indicators on the daily chart are leaning bearish. However, there is not enough confluence among bearish indicators to have confidence in a short trade. For now, we wait on the sidelines to re-evaluate the macro trend once a larger move occurs.