
Cryptocurrency
Trading Bitcoin: Breakout or Dead Cat Bounce?
Breakout or Dead Cat Bounce? Breakout or Dead Cat Bounce? Over the weekend, Bitcoin rallied over 13% and is now trading at a price of $10.7k. Additionally, on the daily chart above, the sequential indicator is on a green 3 of 9 candle showing more upside potential. Yesterday, price formed a green 2 candle which […]

Breakout or Dead Cat Bounce?
Breakout or Dead Cat Bounce? Over the weekend, Bitcoin rallied over 13% and is now trading at a price of $10.7k. Additionally, on the daily chart above, the sequential indicator is on a green 3 of 9 candle showing more upside potential. Yesterday, price formed a green 2 candle which closed above the previous green 1 candle. In sequential theory, a green 2 closing above the previous green 1 is an indication to take a long trade. However, the Lucid SAR (blue x’s) was serving as resistance until it flipped into a bullish position earlier this morning. Most notably, Bitcoin has closed above the 50MA (gray) on the daily chart above which is a significant metric for the bulls.
While the bulls have awoken with force, Bitcoin is still in a descending triangle similar to the one experienced prior to the drop below $6k. Until the bulls break above the downward sloping trend line at $11.3k, the structure of the trend remains bearish.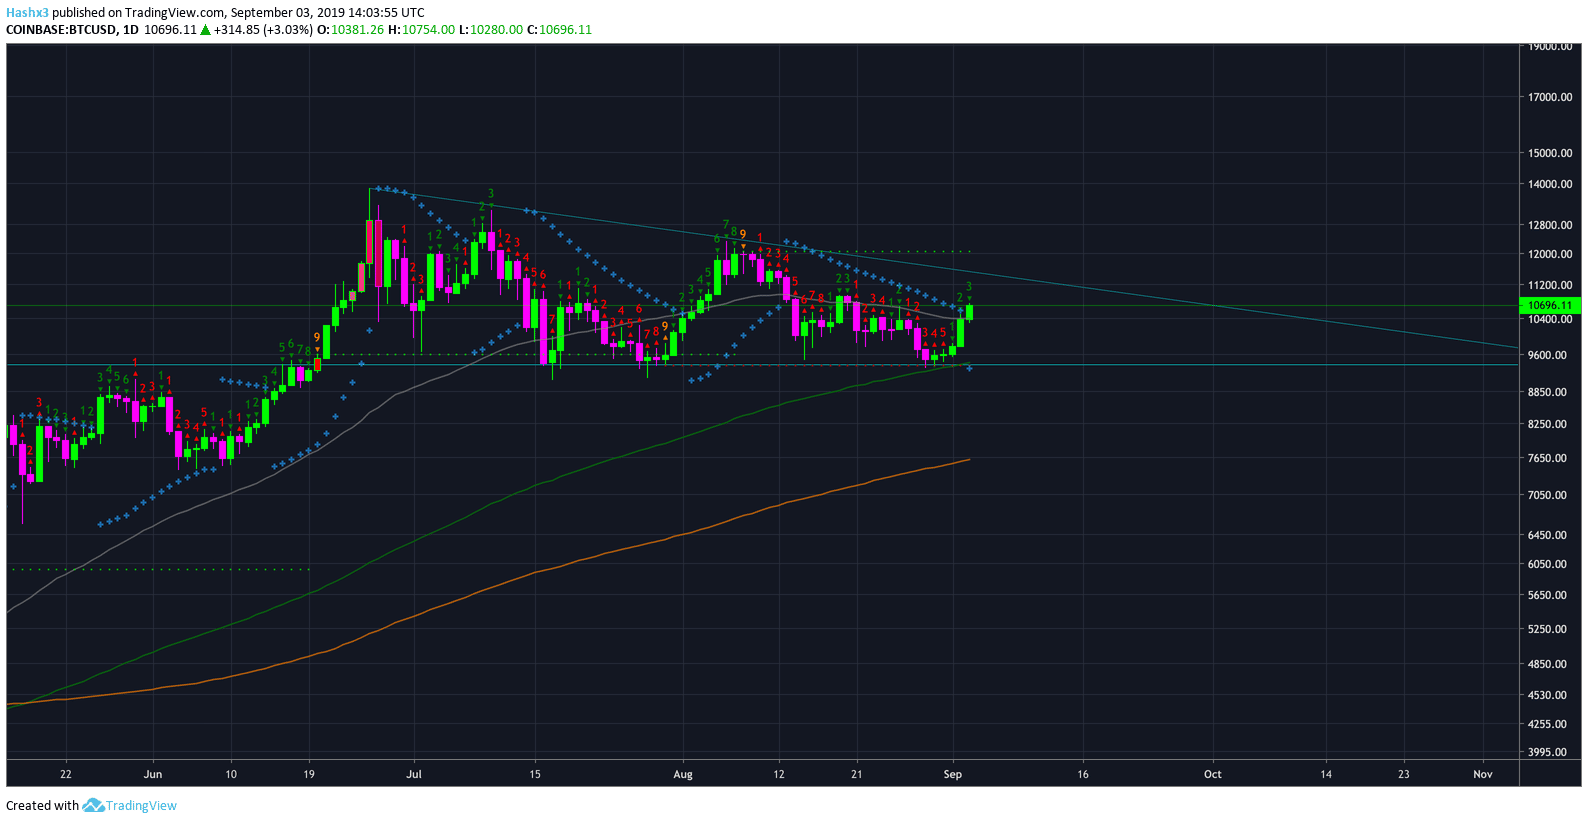
4 Hour
After reaching a green 9 on the 4 hour chart, Bitcoin has exploded to the upside. Price is currently above all three moving averages and is holding steady at $10.7k. Additionally, Bitcoin’s 4 hour RSI is currently at 85 and is in severely overbought territory. Therefore, the uptrend is most likely out of steam in the interim. The bulls may test up to $11k, but until they negate the descending triangle formation, the overall posture of the trend remains neutral-bearish.
Weekly
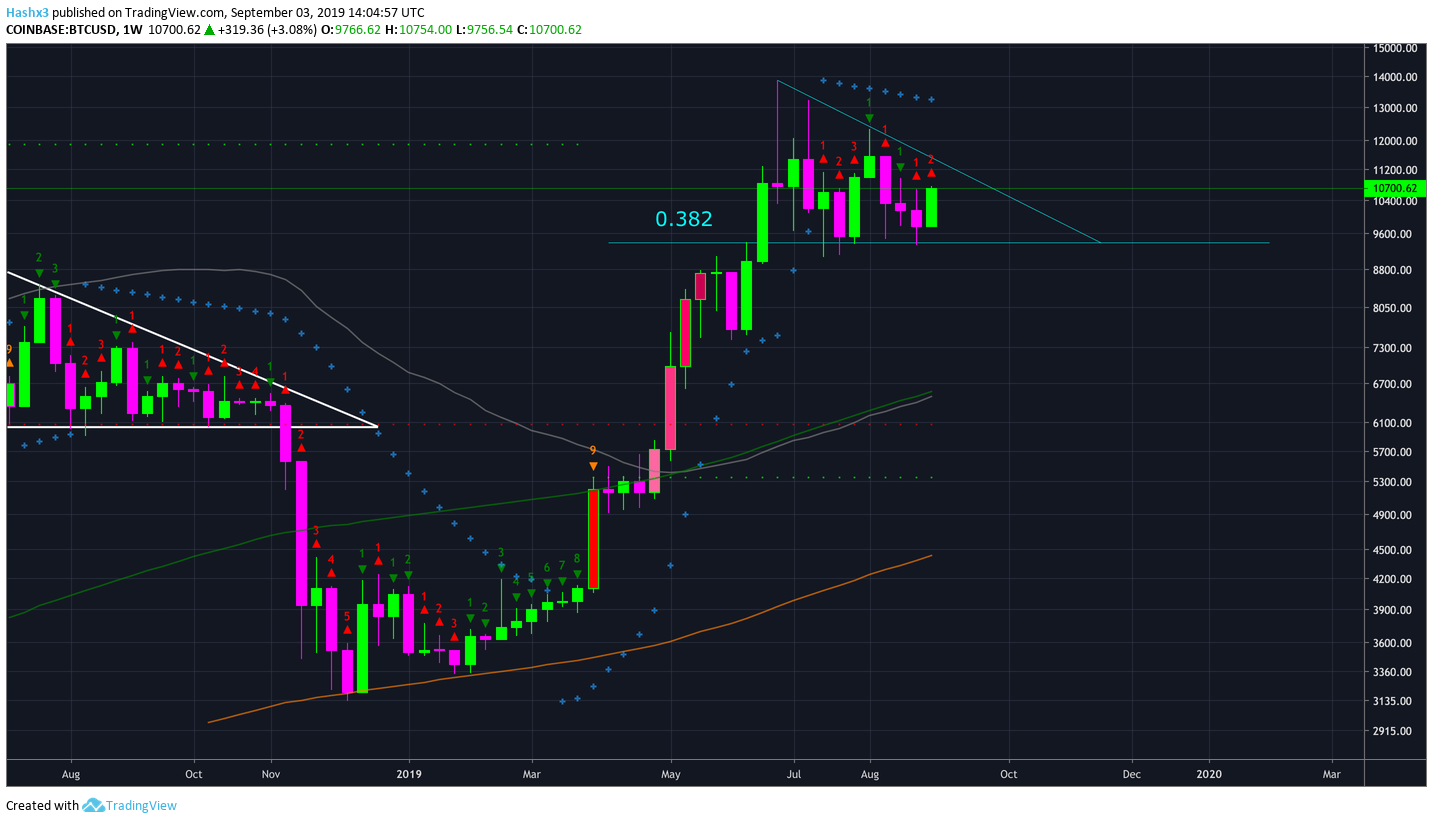
Bitcoin’s weekly chart is on a red 2 candle. For the past 8 weeks, the sequential indicator has been entirely neutral on the weekly chart.
Conclusion
Bitcoin had strong support at $9.5k: The 0.382 fibonacci level, the sequential setup trend line, and the 128MA were all forming a confluence of support at $9.5k. Therefore, it’s not surprising support held. However, each time a support level is tested it becomes weaker. That being said, the bulls have enough momentum to rally price to $11k. But overall, Bitcoin is in a descending triangle formation which, according to classical technical analysis, will break to the downside 70% of the time. Until the bulls can negate the descending trend line by breaking above $11.3k, the trend remains neutral-bearish.