
Cryptocurrency
Trading Bitcoin: Bullish Relief on the 4 Hour
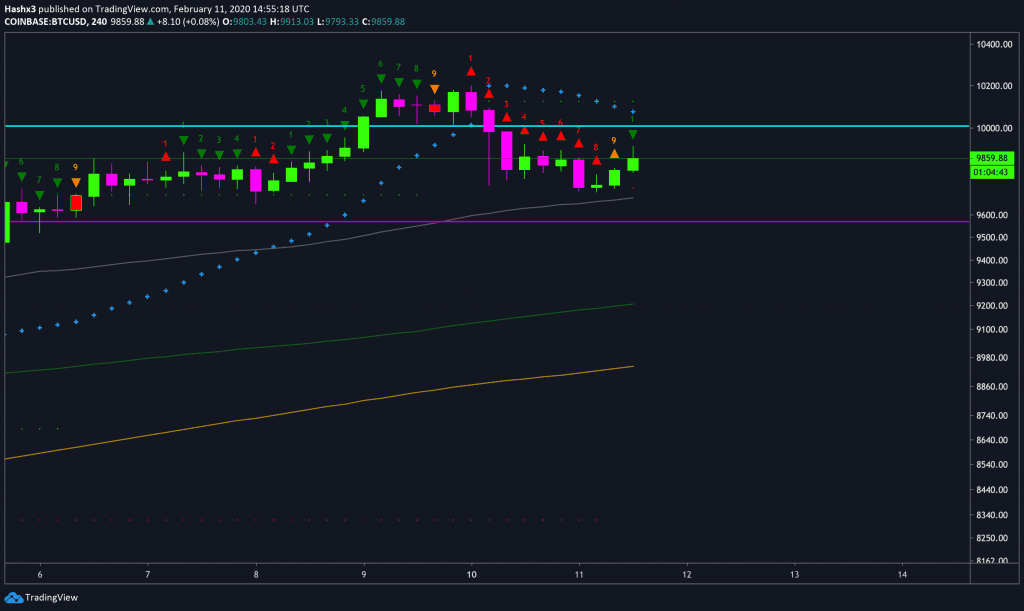
4 Hour Bitcoin has reached a red sequential 9 on the 4 hour chart above, but price has now flipped to a green 1. After bottoming on a red 9, the bulls have seen some relief with a mild rally up to $9.9k. However, the Lucid SAR (blue x’s) is still acting as bearish resistance […]
4 Hour
Bitcoin has reached a red sequential 9 on the 4 hour chart above, but price has now flipped to a green 1. After bottoming on a red 9, the bulls have seen some relief with a mild rally up to $9.9k. However, the Lucid SAR (blue x’s) is still acting as bearish resistance above price. From a bullish perspective, price is still traveling above all three moving averages which are relatively parallel to one another. These moving averages are seen as strong support levels at current time.
Daily
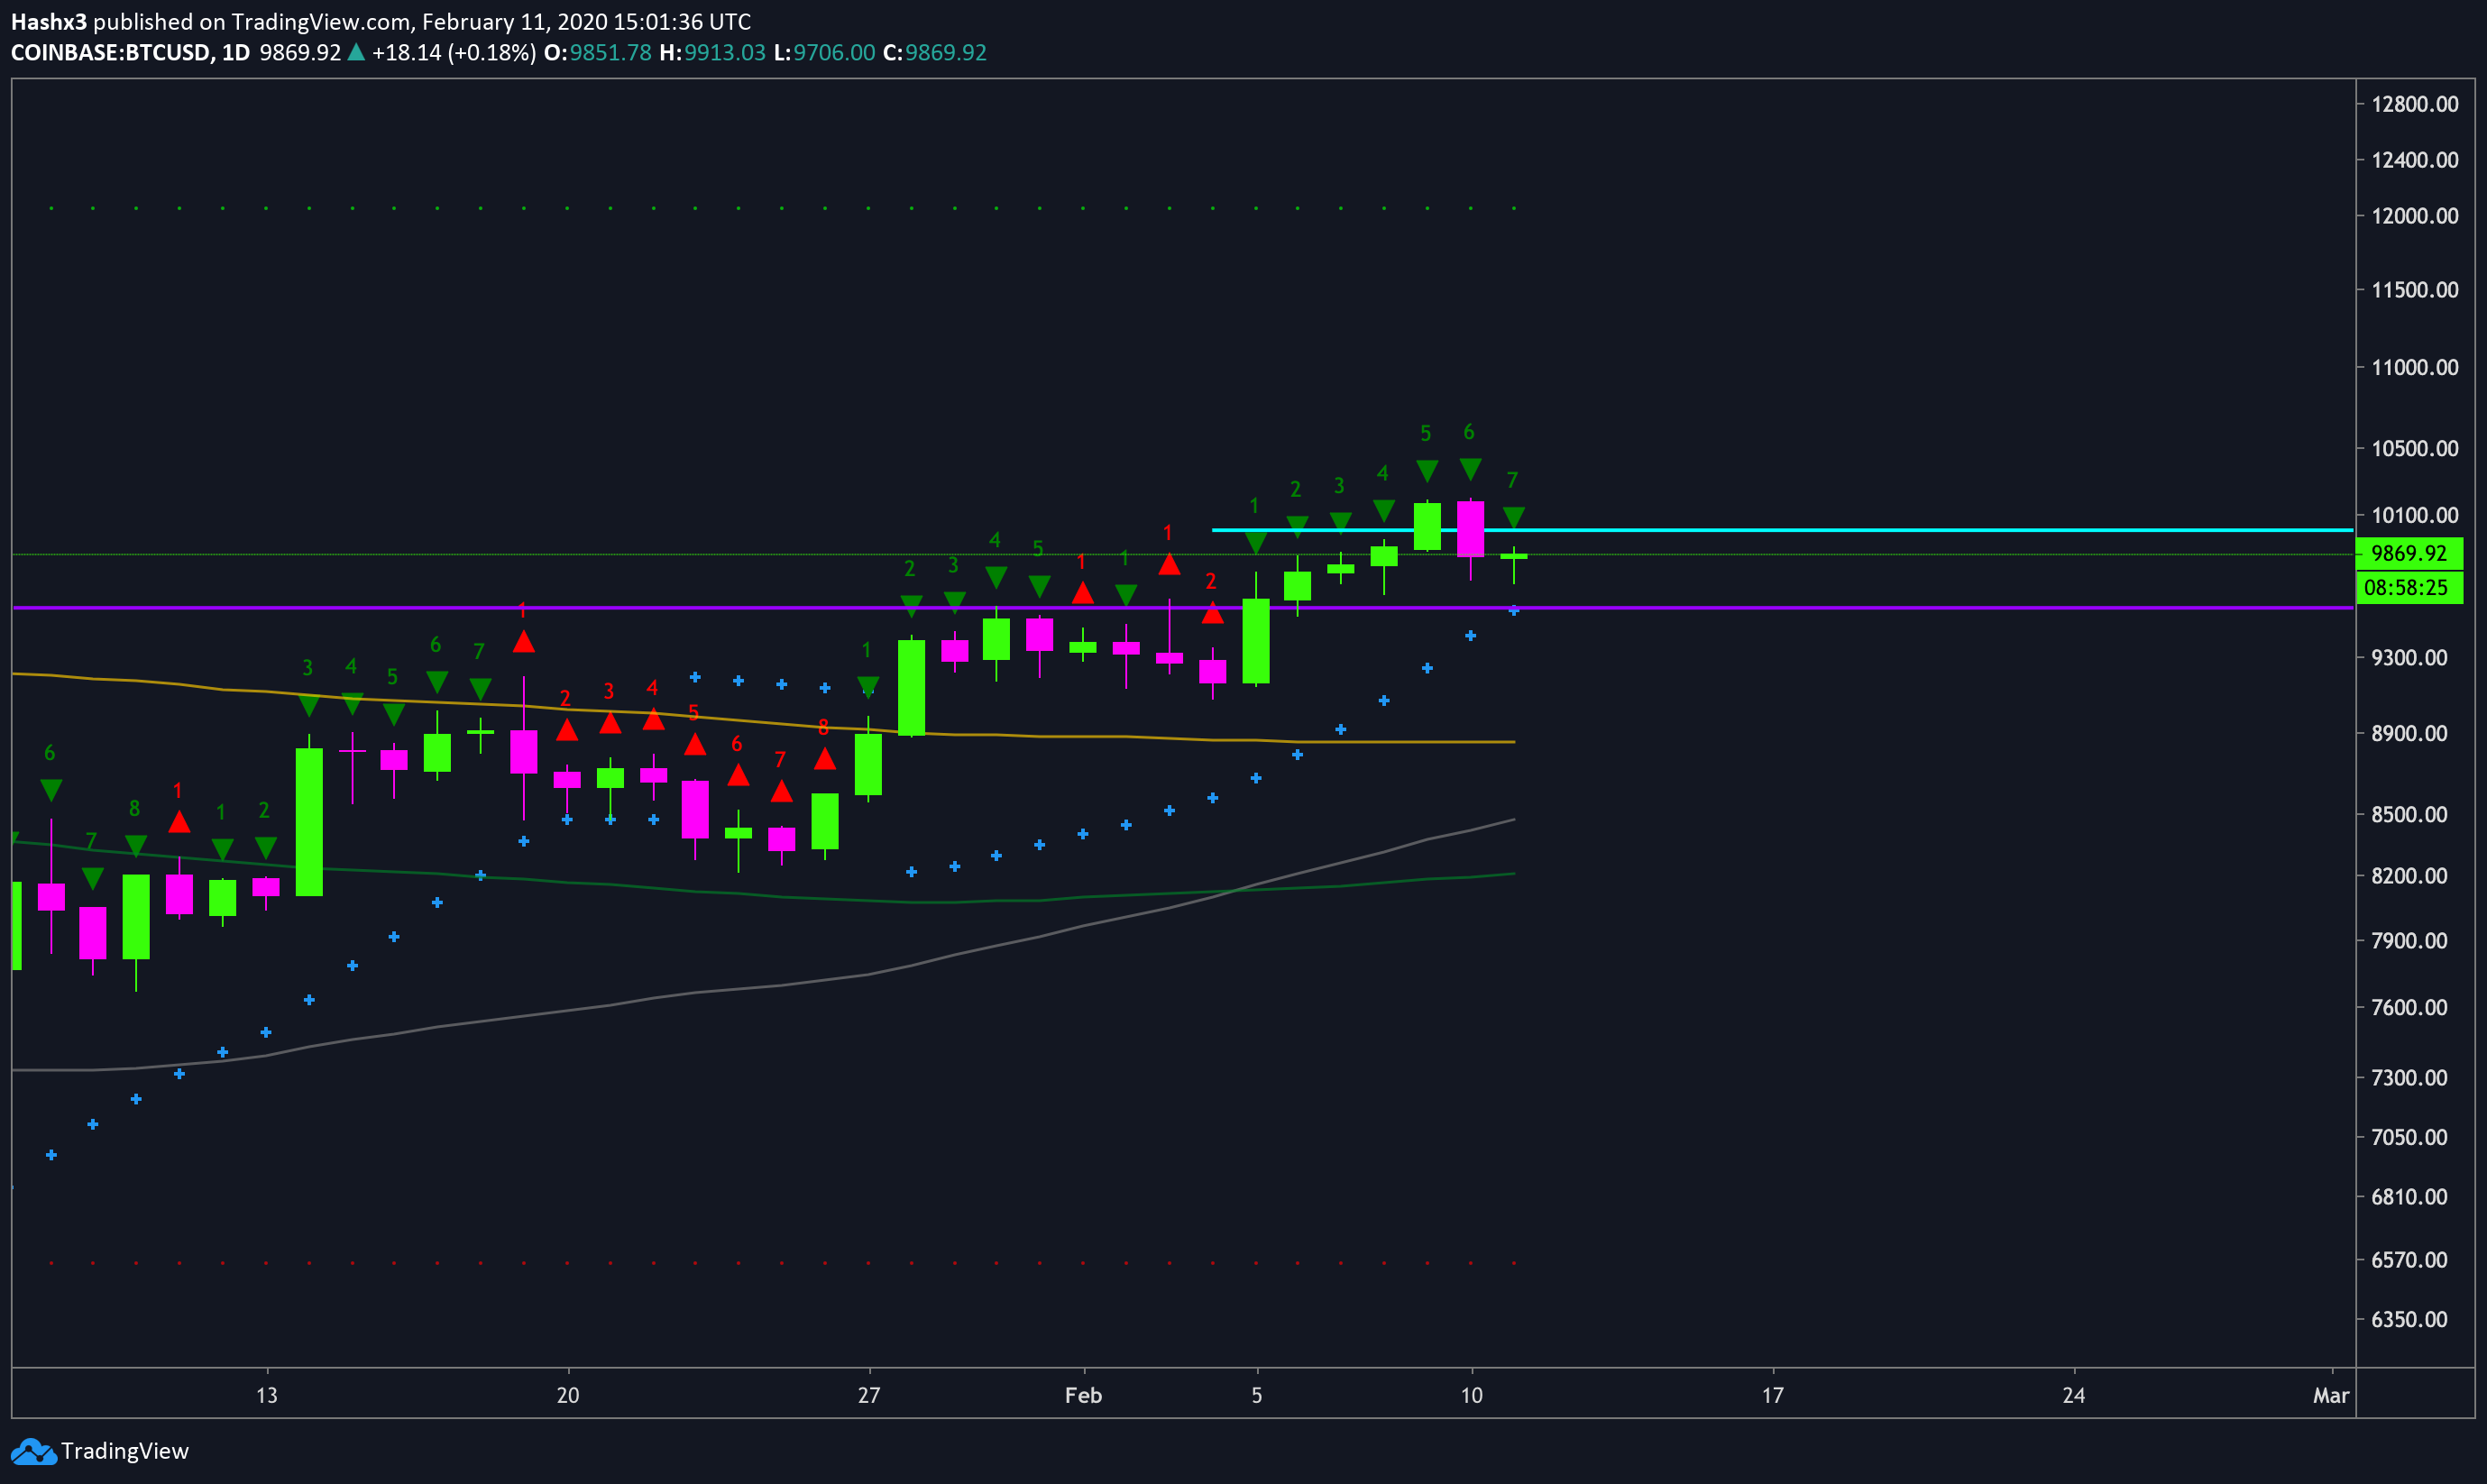
During our current daily candle, price flipped from a green 7 to a red 1, then back to a green 7. Furthermore, the bulls have preserved their strength from a daily timeframe. The sequential indicator is still calling for bullish price action until we experience a price flip to a red 1. The Lucid SAR (blue x’s) are still providing bullish support with the moving averages below. Additionally, the 50MA is about to cross over the 200MA (orange). In classical technical analysis, this is known as a golden cross and is a reflection of profound bullish activity. If bullish momentum sustains, we will likely experience a golden cross on the moving averages.
Conclusion
As of now, our outlook remains bullish – neutral. Critical support stands at $9.5k while current resistance remains at $10k. As long as the bulls can hold support above the 0.618 fibonacci level at $9.5k, the trend remains bullish.