
Cryptocurrency
Trading Bitcoin: Bulls Are Back Amidst Broad Market Sell Off
Daily BTC/USD On the daily chart above, Bitcoin is in a potential bearish head and shoulders pattern. Head and shoulders patterns typically have the highest volume on the left shoulder with declining subsequent volume at the head and right shoulder. In addition, Bitcoin is facing resistance from the 50MA (grey) which may act as a […]

Daily BTC/USD
On the daily chart above, Bitcoin is in a potential bearish head and shoulders pattern. Head and shoulders patterns typically have the highest volume on the left shoulder with declining subsequent volume at the head and right shoulder. In addition, Bitcoin is facing resistance from the 50MA (grey) which may act as a rejection point.
While there are bearish indicators on the daily chart, the sequential indicator is leaning bullish and is currently on a green 4 of 9 candle. Furthermore, the US stock market fell drastically today and yet Bitcoin seems to be doing fine. Also, gold has been increasing as well as other safe haven assets.
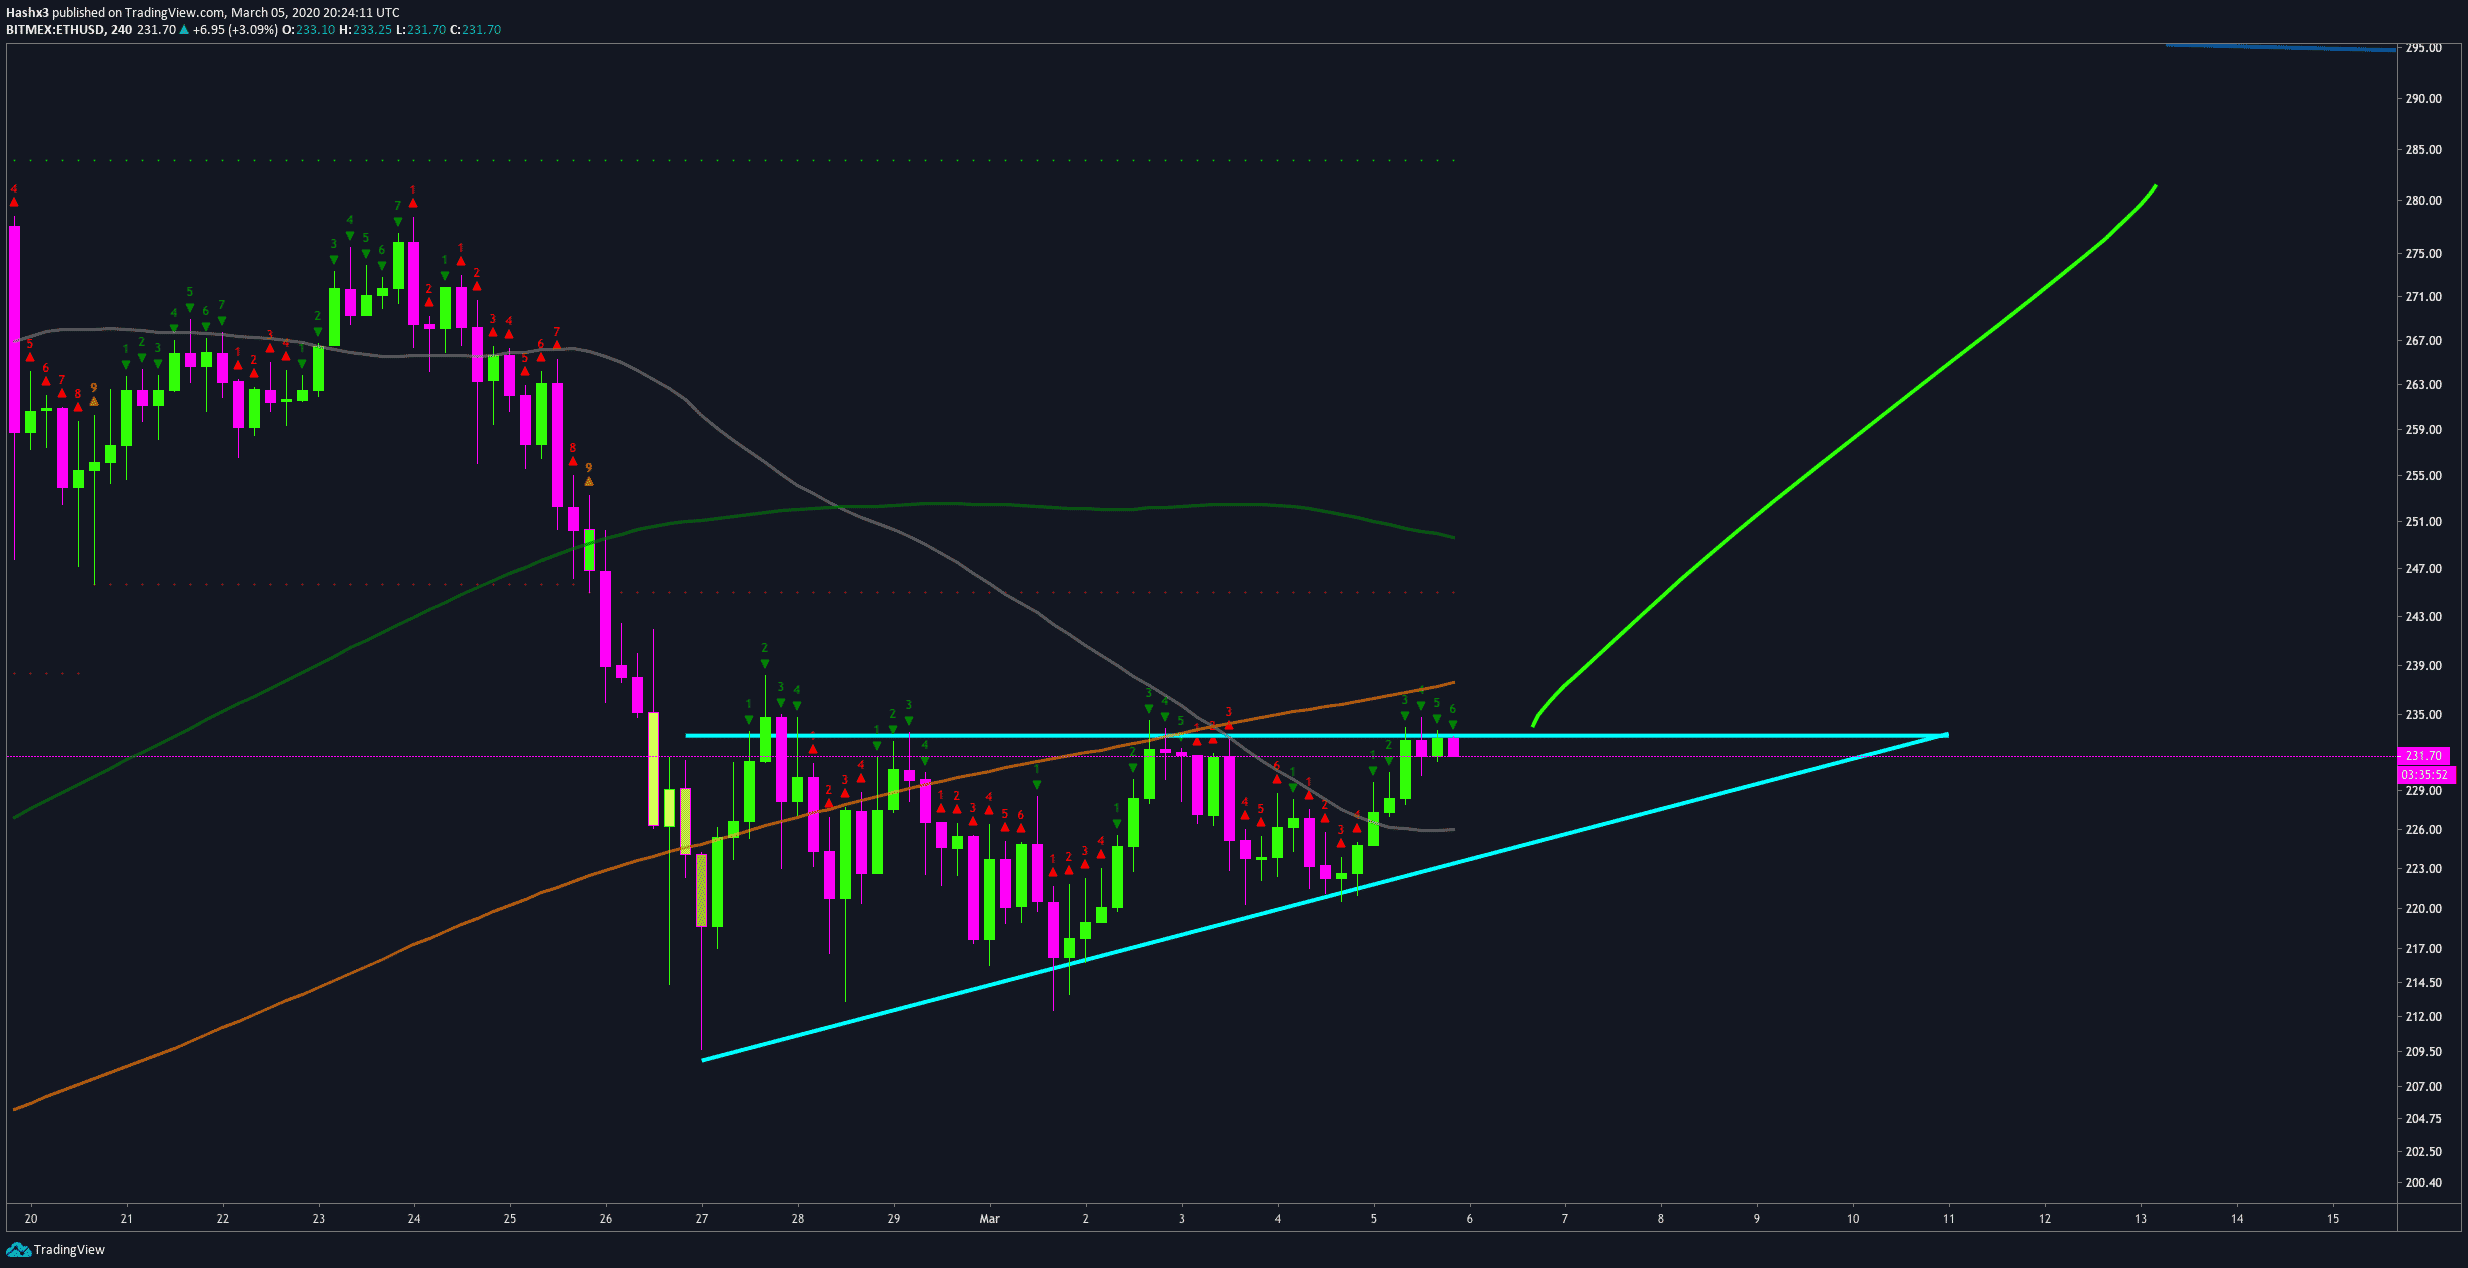
ETH/USD 4 Hour
Ethereum appears to be very bullish on the 4 hour chart above. This is due to the ascending triangle price is currently forming. If we extrapolate the distance of the triangle it gives us a bullish price target of $245. However, price is still below the 200MA (orange). Being said, the direction of the 200MA is critical. For instance, if the moving average is trending upward it will typically serve as weak resistance and strong support. Conversely, if the moving average is trending downward it will typically serve as strong resistance and weak support. Therefore, the Ethereum bulls should be able to break above the 200MA relatively easily.
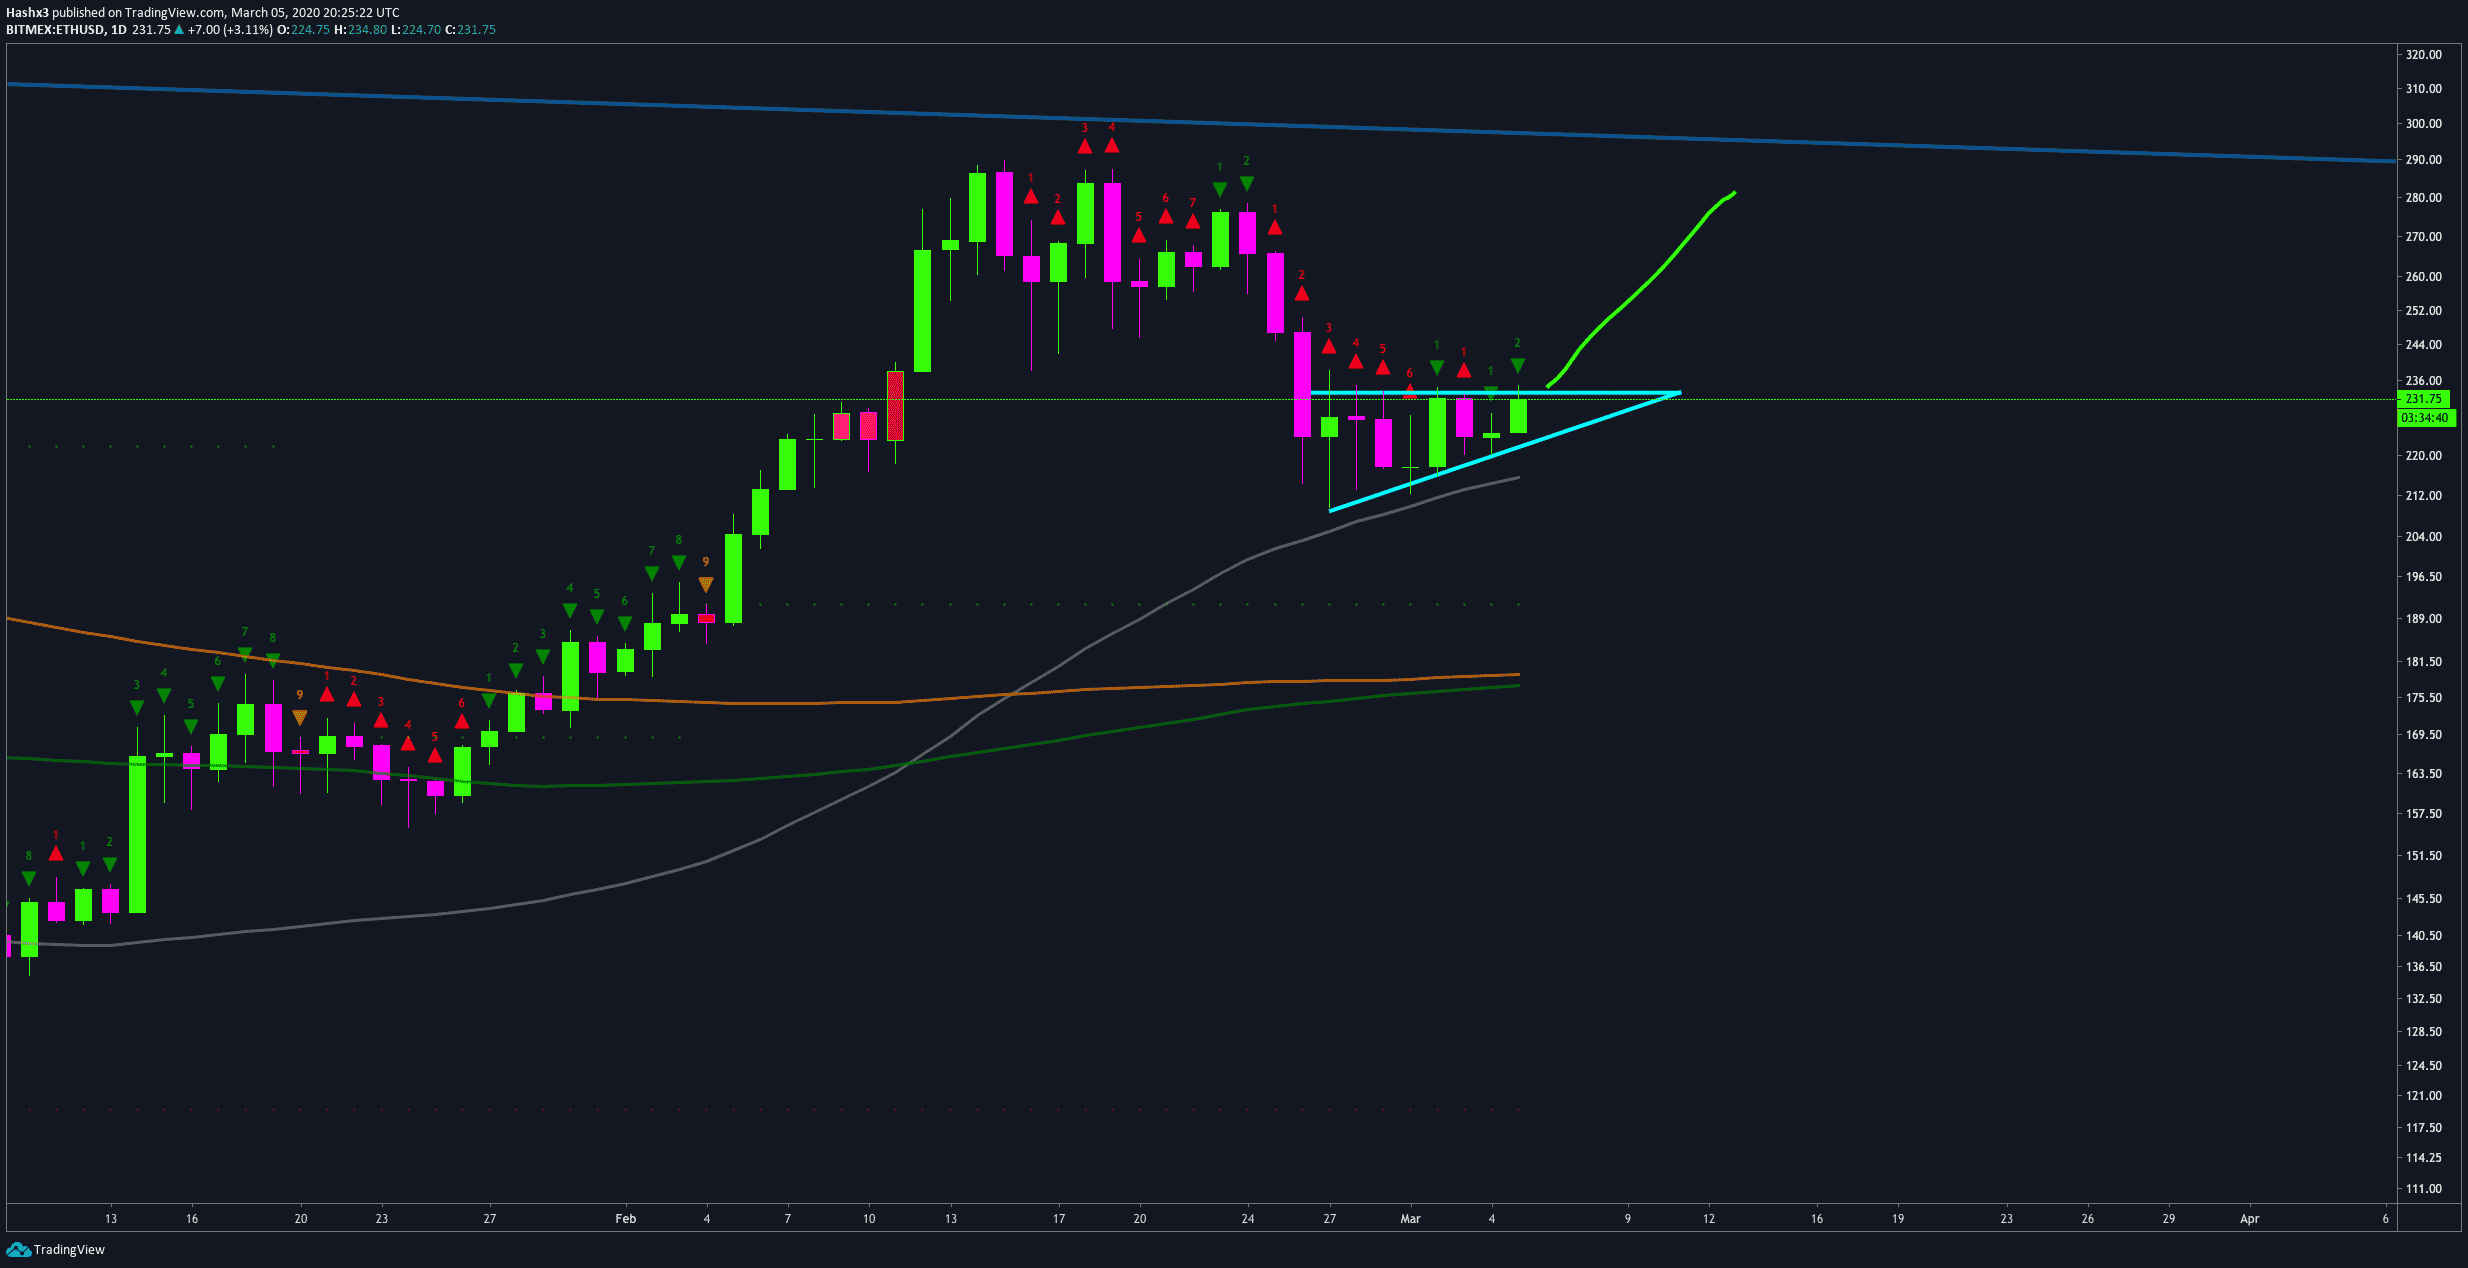
ETH/USD Daily
Not only is Ethereum bullish on the 4 hour, but it is also bullish on the daily chart. Prior to making a trade, ideally you want multiple time frames to have confluence in their indicators. Also, Ethereum has reached a green 2 going above a green 1 on the sequential indicator. This is a very bullish sign in technical analysis and it gave us the conviction to place a long trade on a daily timeframe.
Conclusion
Ethereum is looking very bullish from both a daily and 4 hour timeframe. Bitcoin is appearing neutral while the US Stock market attempts to stabilize. The next few days will be very telling to see whether Bitcoin and crypto can thrive in the face of a US Stock Market correction.