
Cryptocurrency
Trading Bitcoin: Bulls Fight to Hold Support
Daily Bitcoin has reached a red 6 on the daily chart. Our current red 6 candle is a potential reversal candle going into the weekend. However, sequential is still telling us there will likely be 3 more days of neutral – bearish price action. If we reach a red 9 in three days and are […]

Daily
Bitcoin has reached a red 6 on the daily chart. Our current red 6 candle is a potential reversal candle going into the weekend. However, sequential is still telling us there will likely be 3 more days of neutral – bearish price action. If we reach a red 9 in three days and are still above $8.4k, the trend may have a good likelihood of reversing. Also, the Lucid SAR (blue x’s) are acting as bearish resistance above price at roughly $8.6k. Another indicator to acknowledge is the RSI. Notice the bullish divergence displayed in the chart above. Bitcoin has created three consecutive higher lows on the RSI. Bitcoin must remain above this trend line on the RSI for bullish momentum to continue.
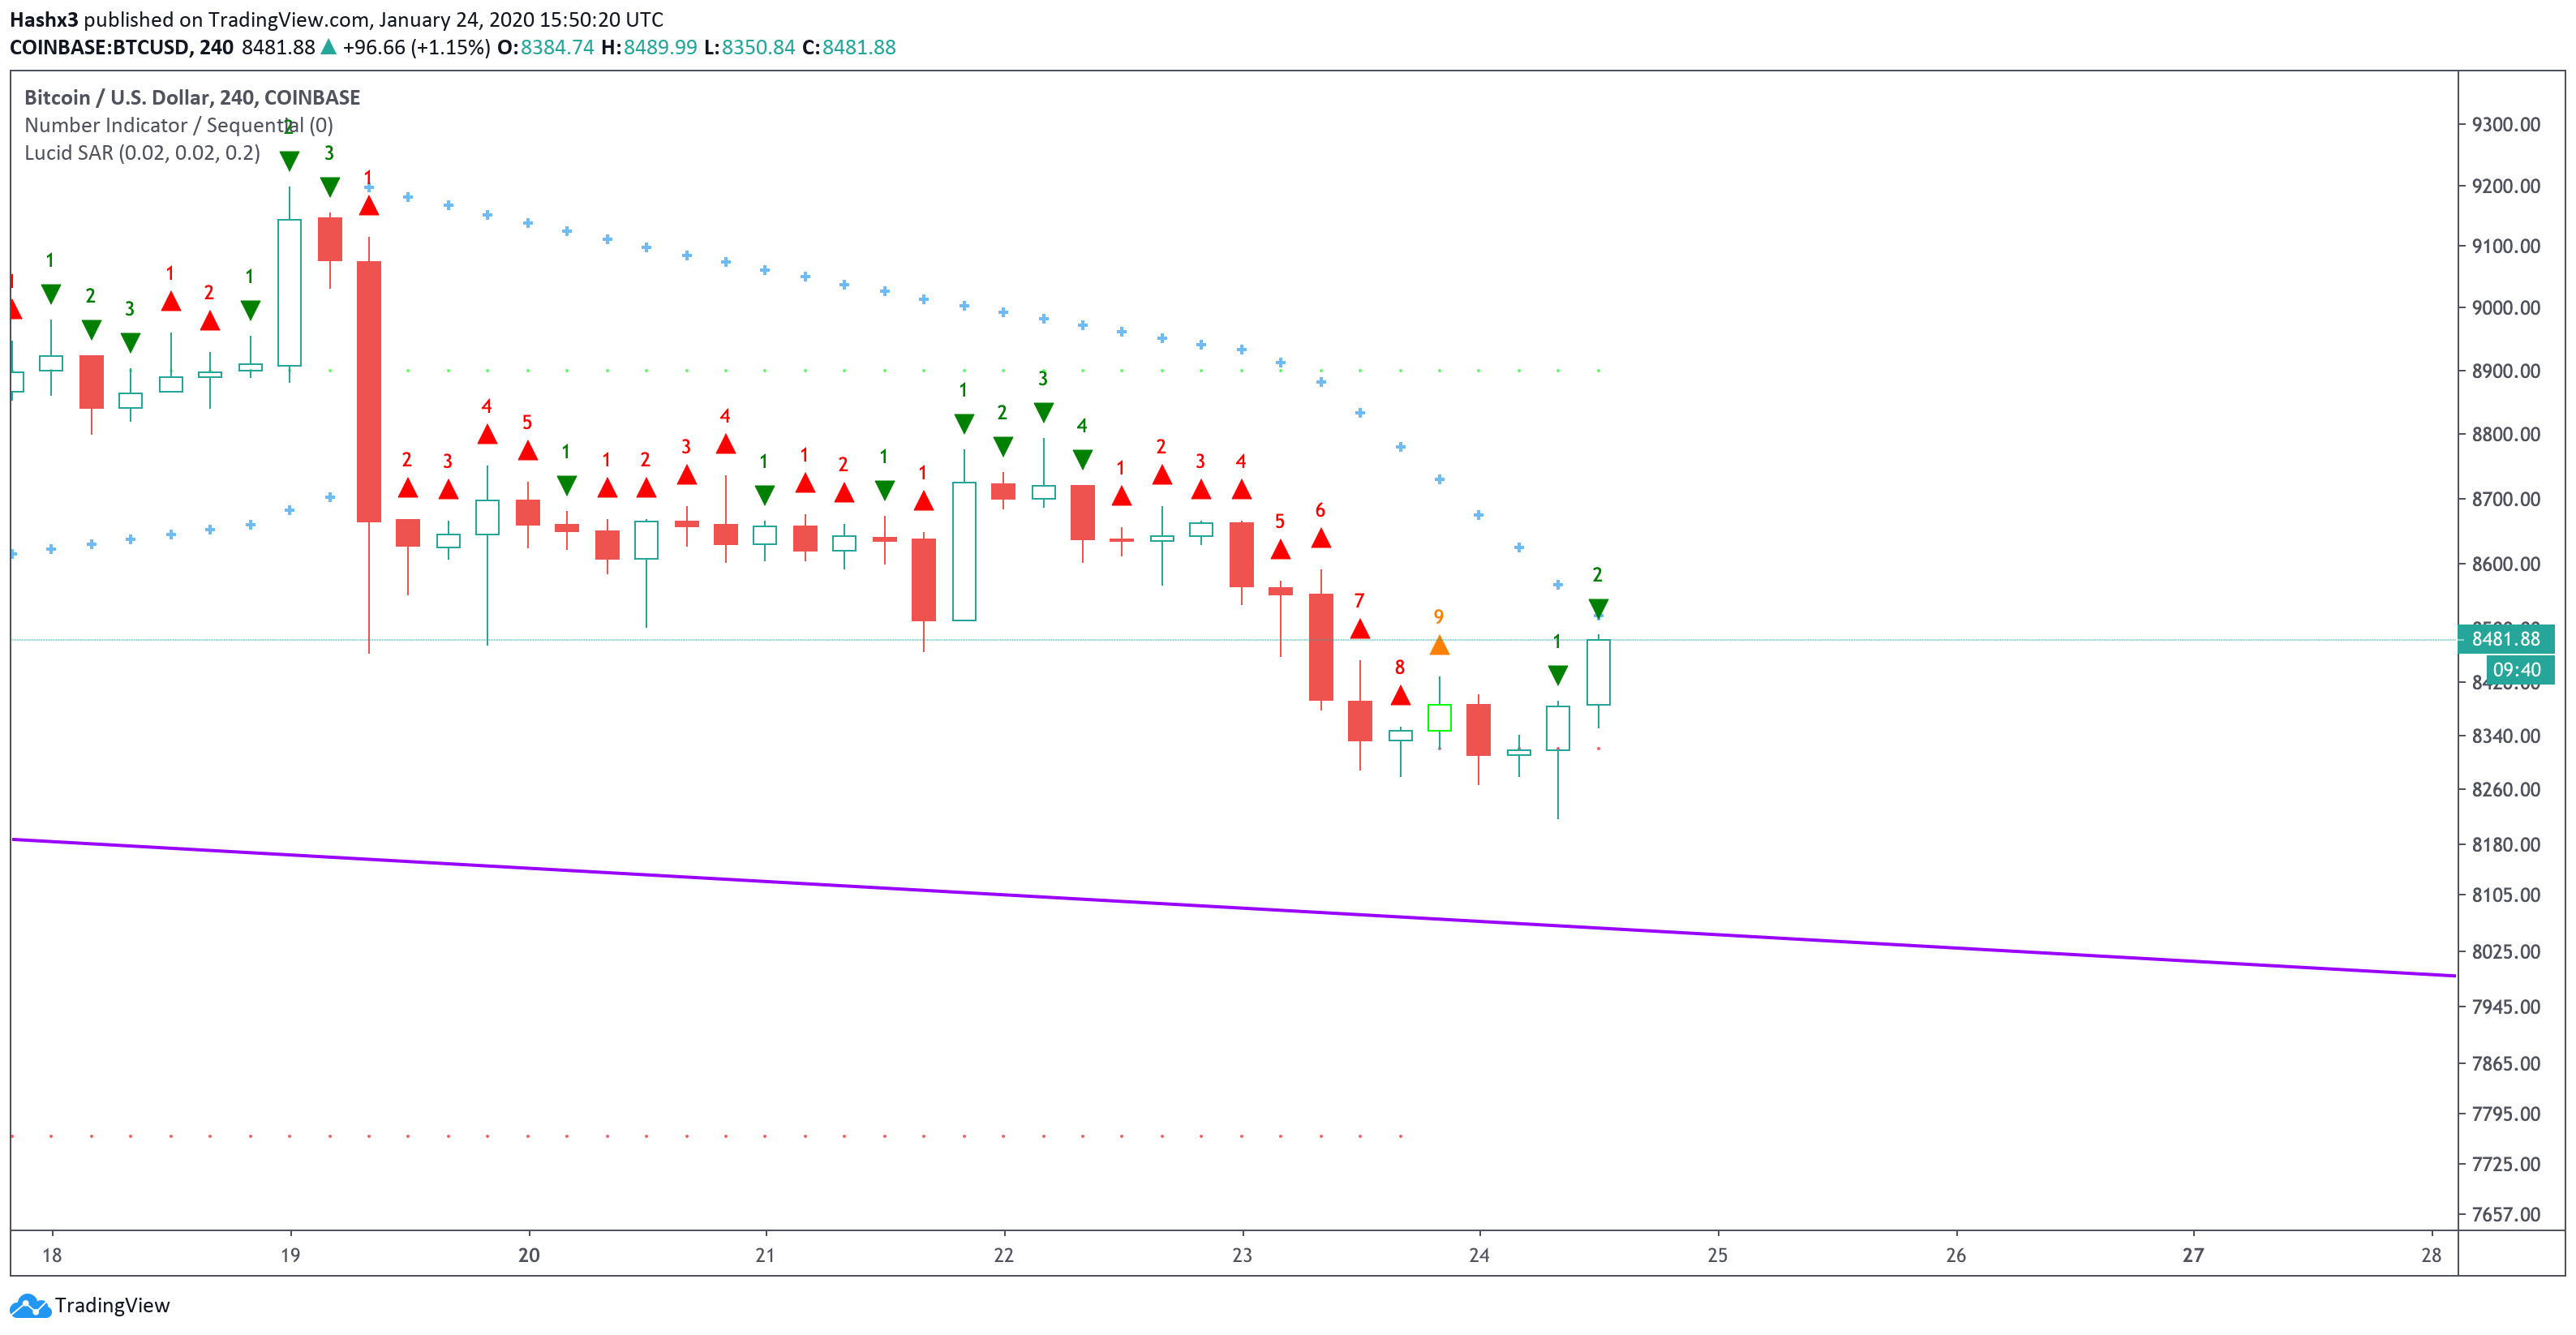
4 Hour
The sequential indicator has reached a green 2 on the 4 hour chart above. In sequential theory, a green 2 which closes above the previous green 1 candle is an indication to place a long trade. Being said, the Lucid SAR is still in a bearish position above price. Still, the trend looks like it has a chance of reversing after bottoming on a red 9. The fact that the previous green 1 candle was a reversal candle further reinforces the bullish bias.
Conclusion
Bitcoin is rebounding from support at $8.2k. For now, the daily chart remains neutral – bearish for the next 3 days while the 4 hour chart is already providing bullish signals. Support remains at $8.2k with critical resistance at $9k.
Disclaimer: The author of the article hodls Bitcoin.