
Cryptocurrency
Trading Bitcoin: Bulls Still Holding Above $9.2k
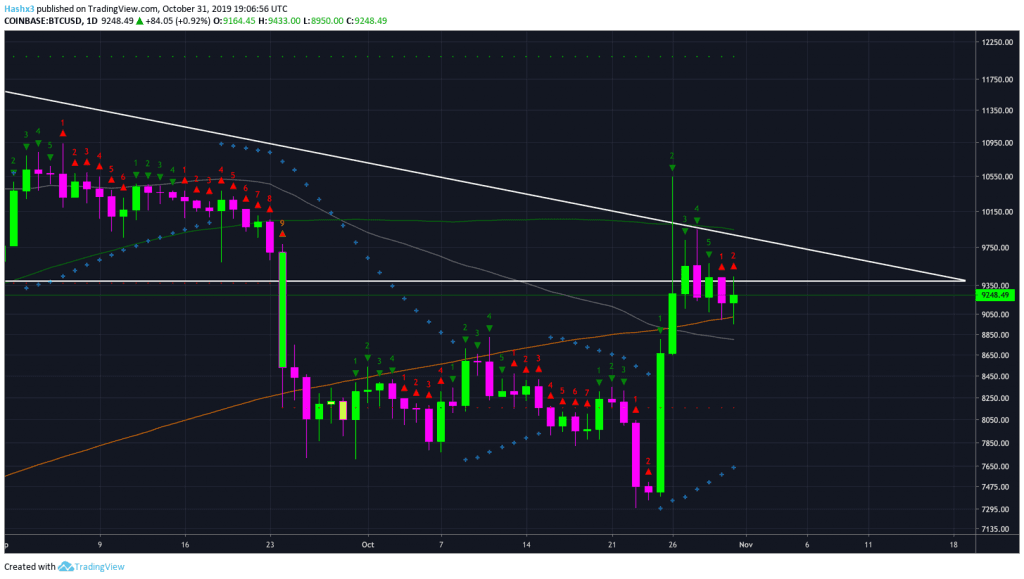
Bulls Still Holding Above $9.2k After being rejected at $10.5, Bitcoin is still trading above the $9.2k support level. On the daily chart above, sequential is on a red 2 candle. However, our current red 2 candle has not closed below the previous red 1 candle. Therefore, we are still in neutral – bullish territory. […]
Bulls Still Holding Above $9.2k
After being rejected at $10.5, Bitcoin is still trading above the $9.2k support level. On the daily chart above, sequential is on a red 2 candle. However, our current red 2 candle has not closed below the previous red 1 candle. Therefore, we are still in neutral – bullish territory. Remember, sequential theory only measures momentum through time, not momentum through price. Additionally, the Lucid SAR (blue x) is still acting as bullish support below price. In terms of support, price is still trading above the 200MA (orange). In a bull market, Bitcoin has rarely ever traded below the 200MA.
4 Hour
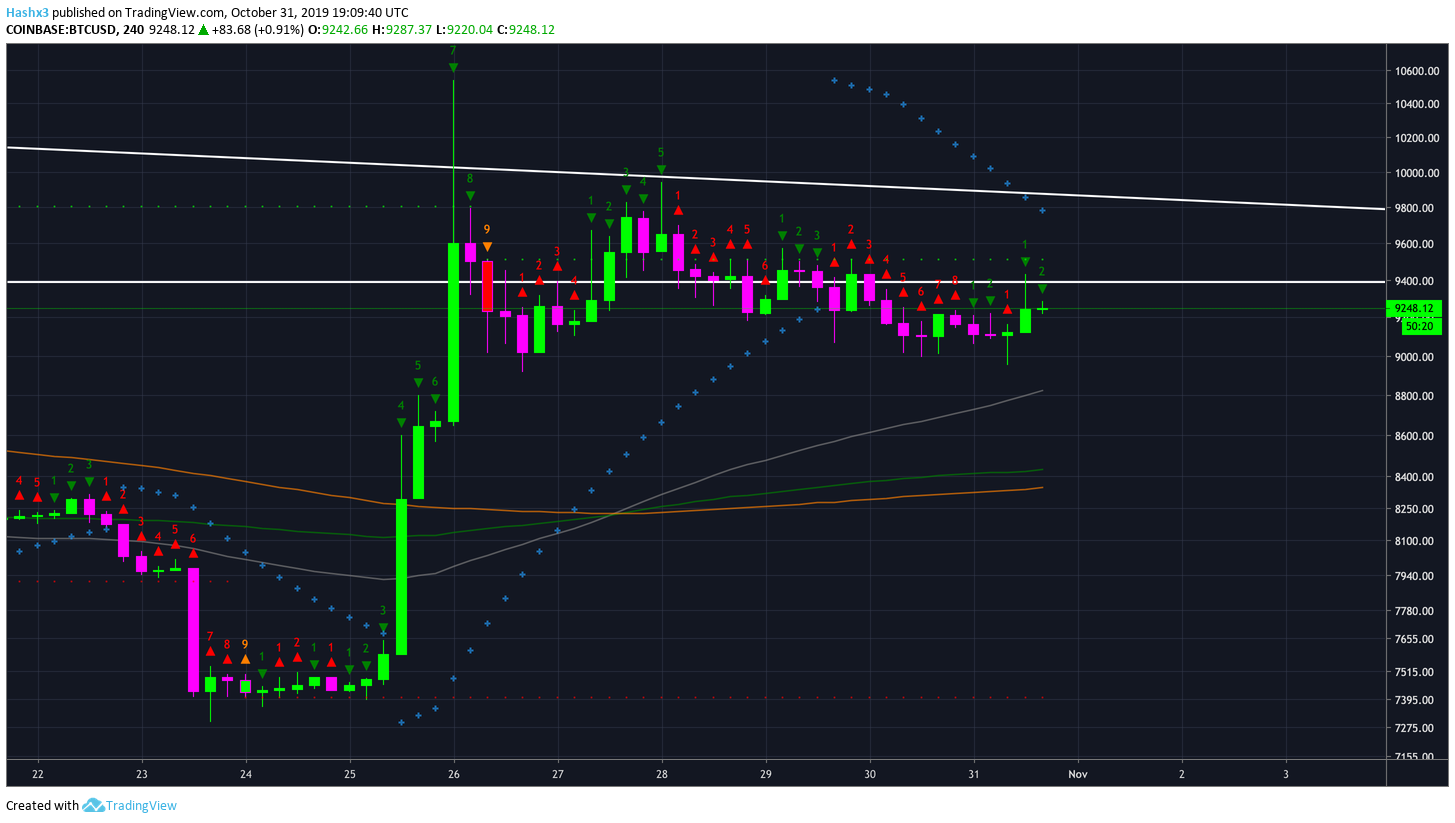
On the 4 hour chart, Bitcoin has just formed a green 2 going above a green 1. In sequential theory, this is an indication to place a long trade. Additionally, the moving averages have just formed a golden cross which is a bullish continuation pattern in classical technical analysis. However, the Lucid SAR (blue x) is still trading in a bearish position above price. Overall, the 4 hour chart is neutral – bullish.
Conclusion
As of now, Bitcoin is neutral – bullish across multiple timeframes. In order for the bulls to sustain the trend, price needs to remain above $9k and continue to close above the daily 200MA (orange). If price does not remain above these levels, then a bearish retest of $8.7k is in the cards.