
Cryptocurrency
Trading Bitcoin: Bulls Won’t Back Down
Daily As the Corona Virus spreads, the S&P 500 is down 1.5% today. Meanwhile, Bitcoin is up about 2% as price trades at roughly $8.7k. On the daily chart above, you can see that we are still below the 200MA (orange) and the 0.618 Fibonacci level, which will serve as critical resistance at roughly $9k. […]

Daily
As the Corona Virus spreads, the S&P 500 is down 1.5% today. Meanwhile, Bitcoin is up about 2% as price trades at roughly $8.7k. On the daily chart above, you can see that we are still below the 200MA (orange) and the 0.618 Fibonacci level, which will serve as critical resistance at roughly $9k. After reaching a red 8 on the daily, the sequential indicator has undergone a price flip to a green 1. Furthermore, we are now in a bullish setup phase of sequential. While the 200MA is still acting as resistance, the 50MA is about have a bullish crossover on the daily chart which provides the bulls with a rising support level.
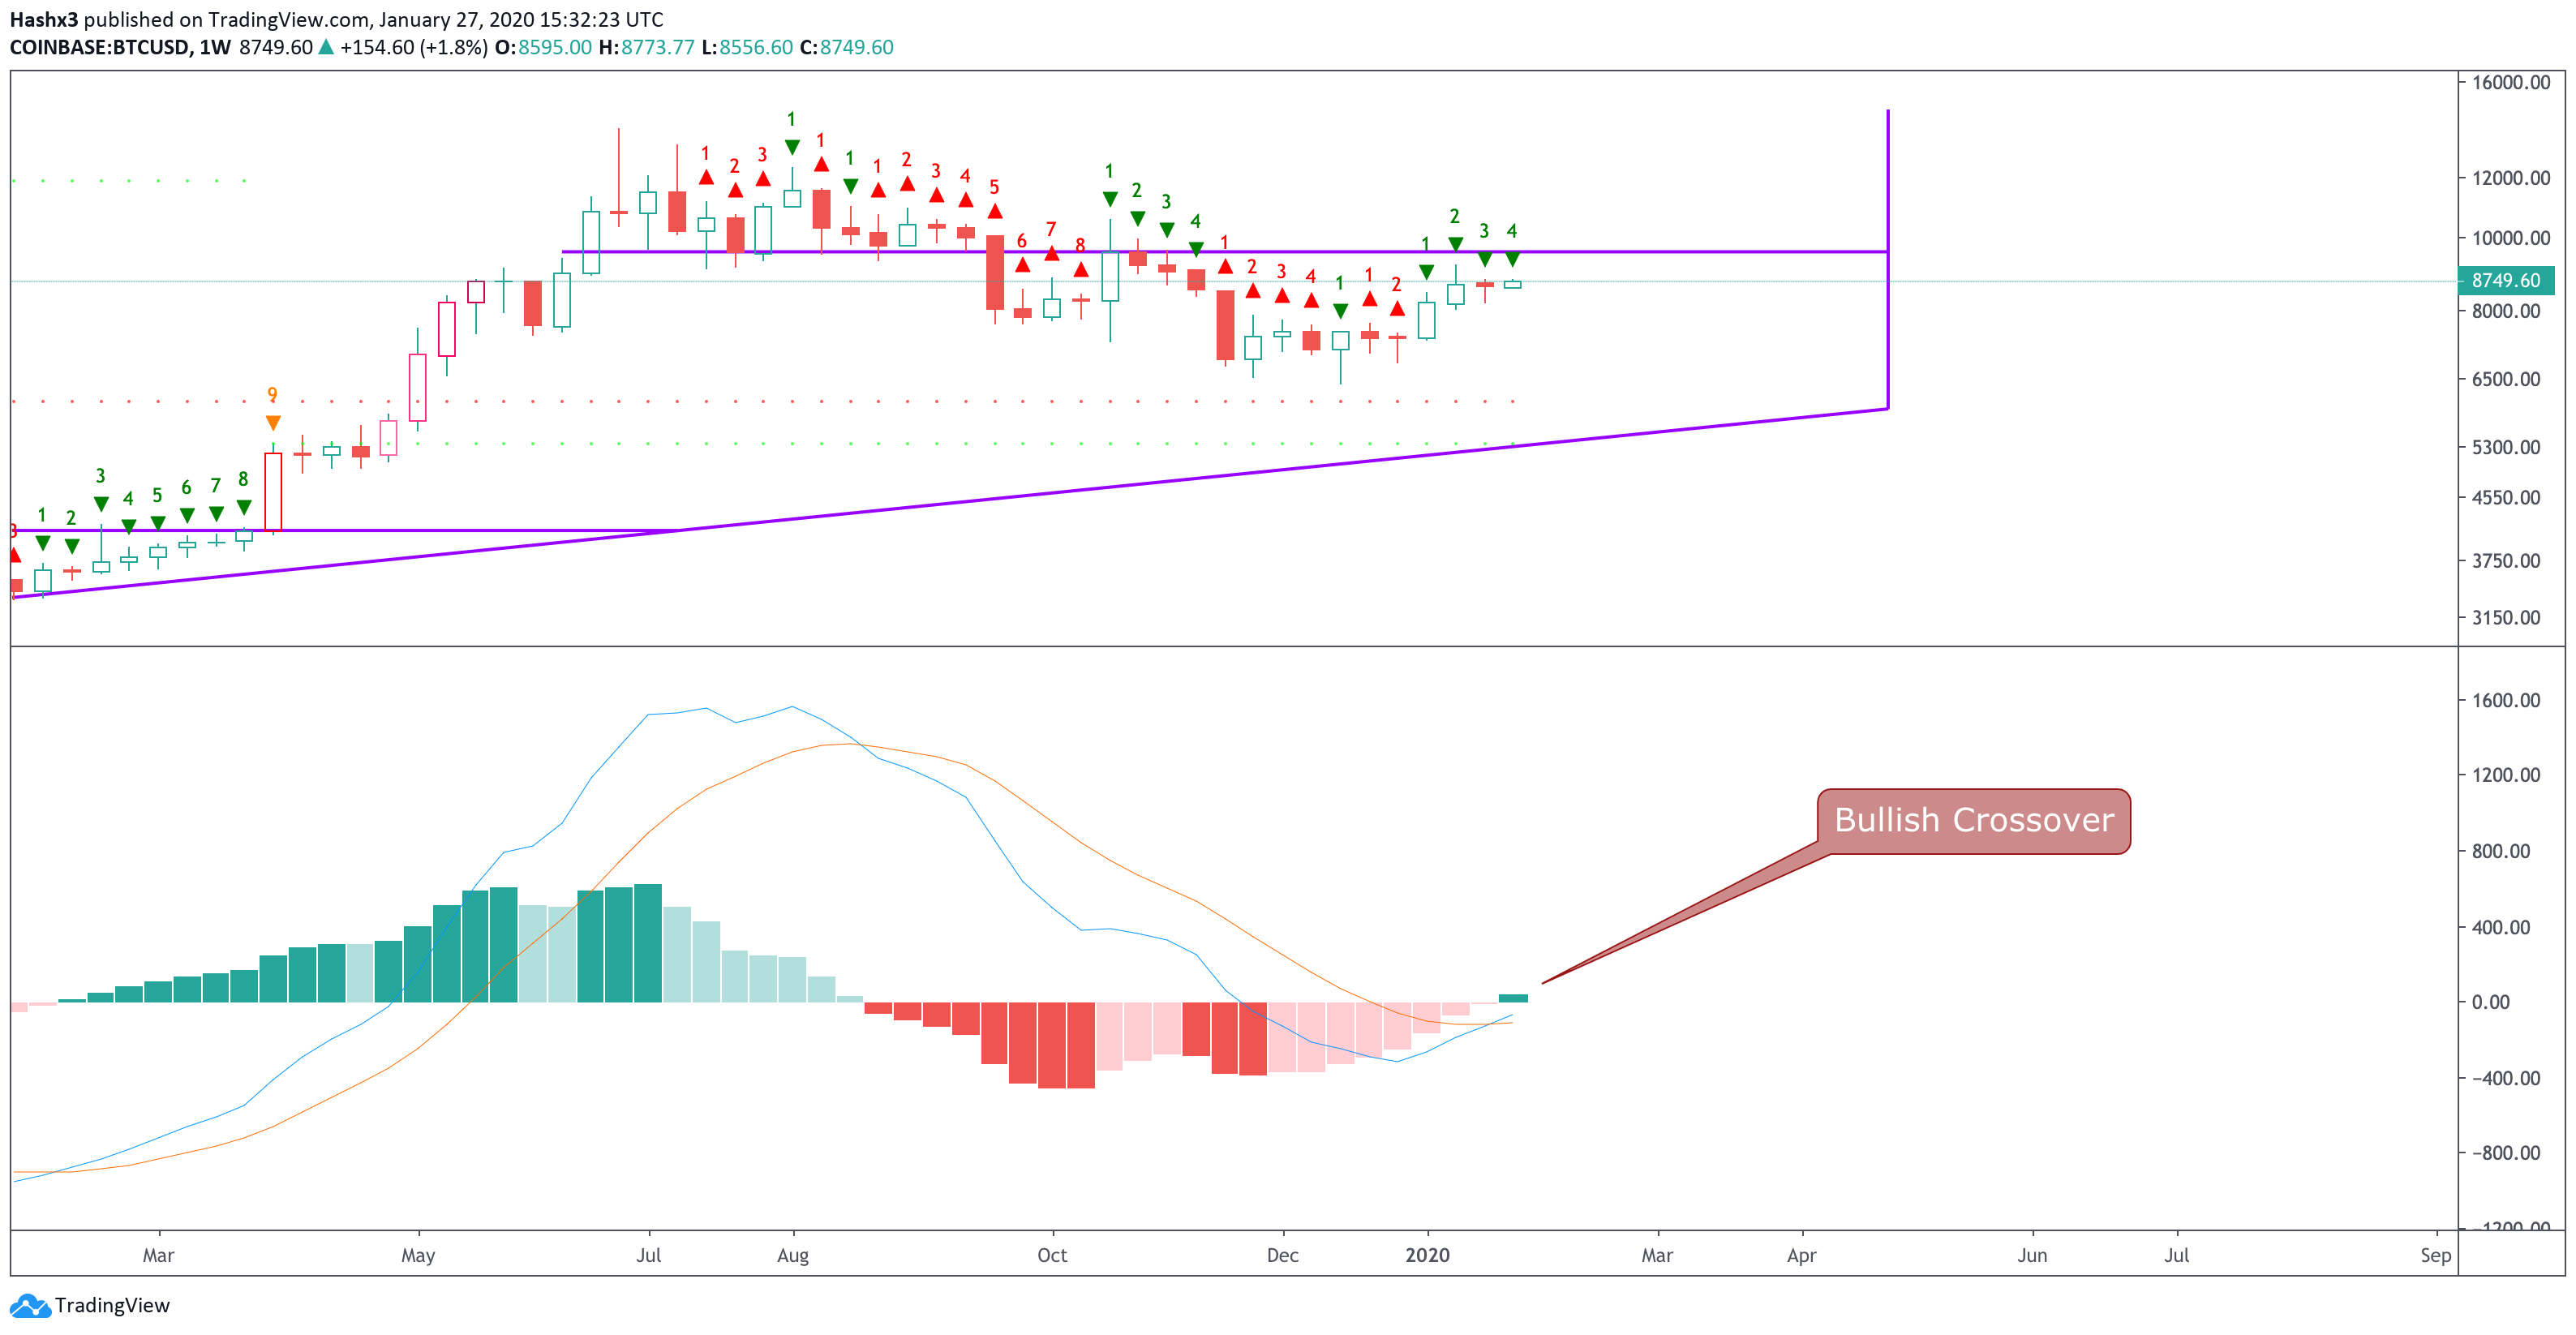
Weekly
The weekly chart continues to be bullish. The MACD is experiencing a bullish crossover, which has been a significant bullish indicator in the past. Additionally, the sequential indicator is on a green 4 of 9 candle which tells us neutral-bullish price action is likely to continue for the next 5 weeks. Above all, the bulls will have to break above the 0.618 Fibonacci level in order to pave the way for higher highs.
Conclusion
After being bearish for the majority of last week, Bitcoin’s daily chart is now presenting bullish – neutral signals. The weekly chart is looking very bullish from a macro perspective, but we still need follow through with a break above the 0.618 fibonacci level.